Before your next board meeting, consider what your finance team will be doing the night before. If the answer involves patching spreadsheet formulas, manually refreshing charts, or rebuilding a dashboard that broke when you updated last month’s actuals, the report itself is already a problem.
Board members ask hard questions: Why is this program over budget? Where did that grant funding go? What happens to our cash position if this funder does not renew? The expectation is that you will answer clearly, quickly, and with confidence. The reality, for many nonprofit finance teams, is that answering those questions requires scrambling through worksheets that were not designed to be interrogated.
This post covers the financial information boards need to see, what makes a report credible, and how the underlying structure of your financial data determines whether board reporting is an asset or a liability.
Many board members serve because of subject matter expertise, community ties, or fundraising relationships, and they typically don’t have a finance background. They are scanning for signals and not reading line items.
Core questions tend to cluster around three concerns:
Listing every account balance across every program may be technically complete, but it makes the report unreadable for the people who need to act on it.
If the board needs to understand the cash position, show the cash position prominently, in context, with a trend. If a grant is nearing its end date, surface that proactively. If one program is significantly over or under budget, show the variance and briefly explain it. Boards can handle complexity. What they cannot handle is being handed data and asked to interpret it themselves.
For-profit CFOs and nonprofit finance directors are doing fundamentally different jobs at board time. The nonprofit version requires demonstrating that money moved in accordance with donor intent and funder requirements, a separate obligation from demonstrating solvency.
That education grant can only pay for program staff, not overhead. The government contract reimburses specific line items and these rules are attached to the funds themselves. The board needs to see that restricted dollars are being spent correctly, and auditors need documentation to verify it.
Maintaining this distinction in Excel means running separate sheets per grant, manually allocating payroll by percentage, and hoping that when the funder asks for a report in their specific format, the numbers reconcile. They often do not on the first pass.
A well-structured board report on restricted and unrestricted funds shows both the allocation logic and the spending actuals side by side. When a board member asks why program overhead was charged to a restricted grant, you need to be able to show the calculation instantly, not retrieve it by memory three days later.
The quality of the board report is constrained by how the underlying budget was built.
If your budget lives in Excel, the board report is a snapshot. It reflects what the data looked like when someone last manually updated it. The moment actuals come in from your accounting system, the Excel model requires manual intervention before the report is current again. Every broken formula, mismatched tab or VLOOKUP that suddenly returns zero is a reason the report cannot be distributed on time.
Building budgets in a system that treats data as a connected structure, rather than a collection of cells, changes what is possible. When actuals import directly and roll up through a chart of accounts automatically, the board report stays current without manual intervention. Rebuilding variance analysis from scratch is no longer necessary, and drill-down into any figure is available without opening a second spreadsheet.
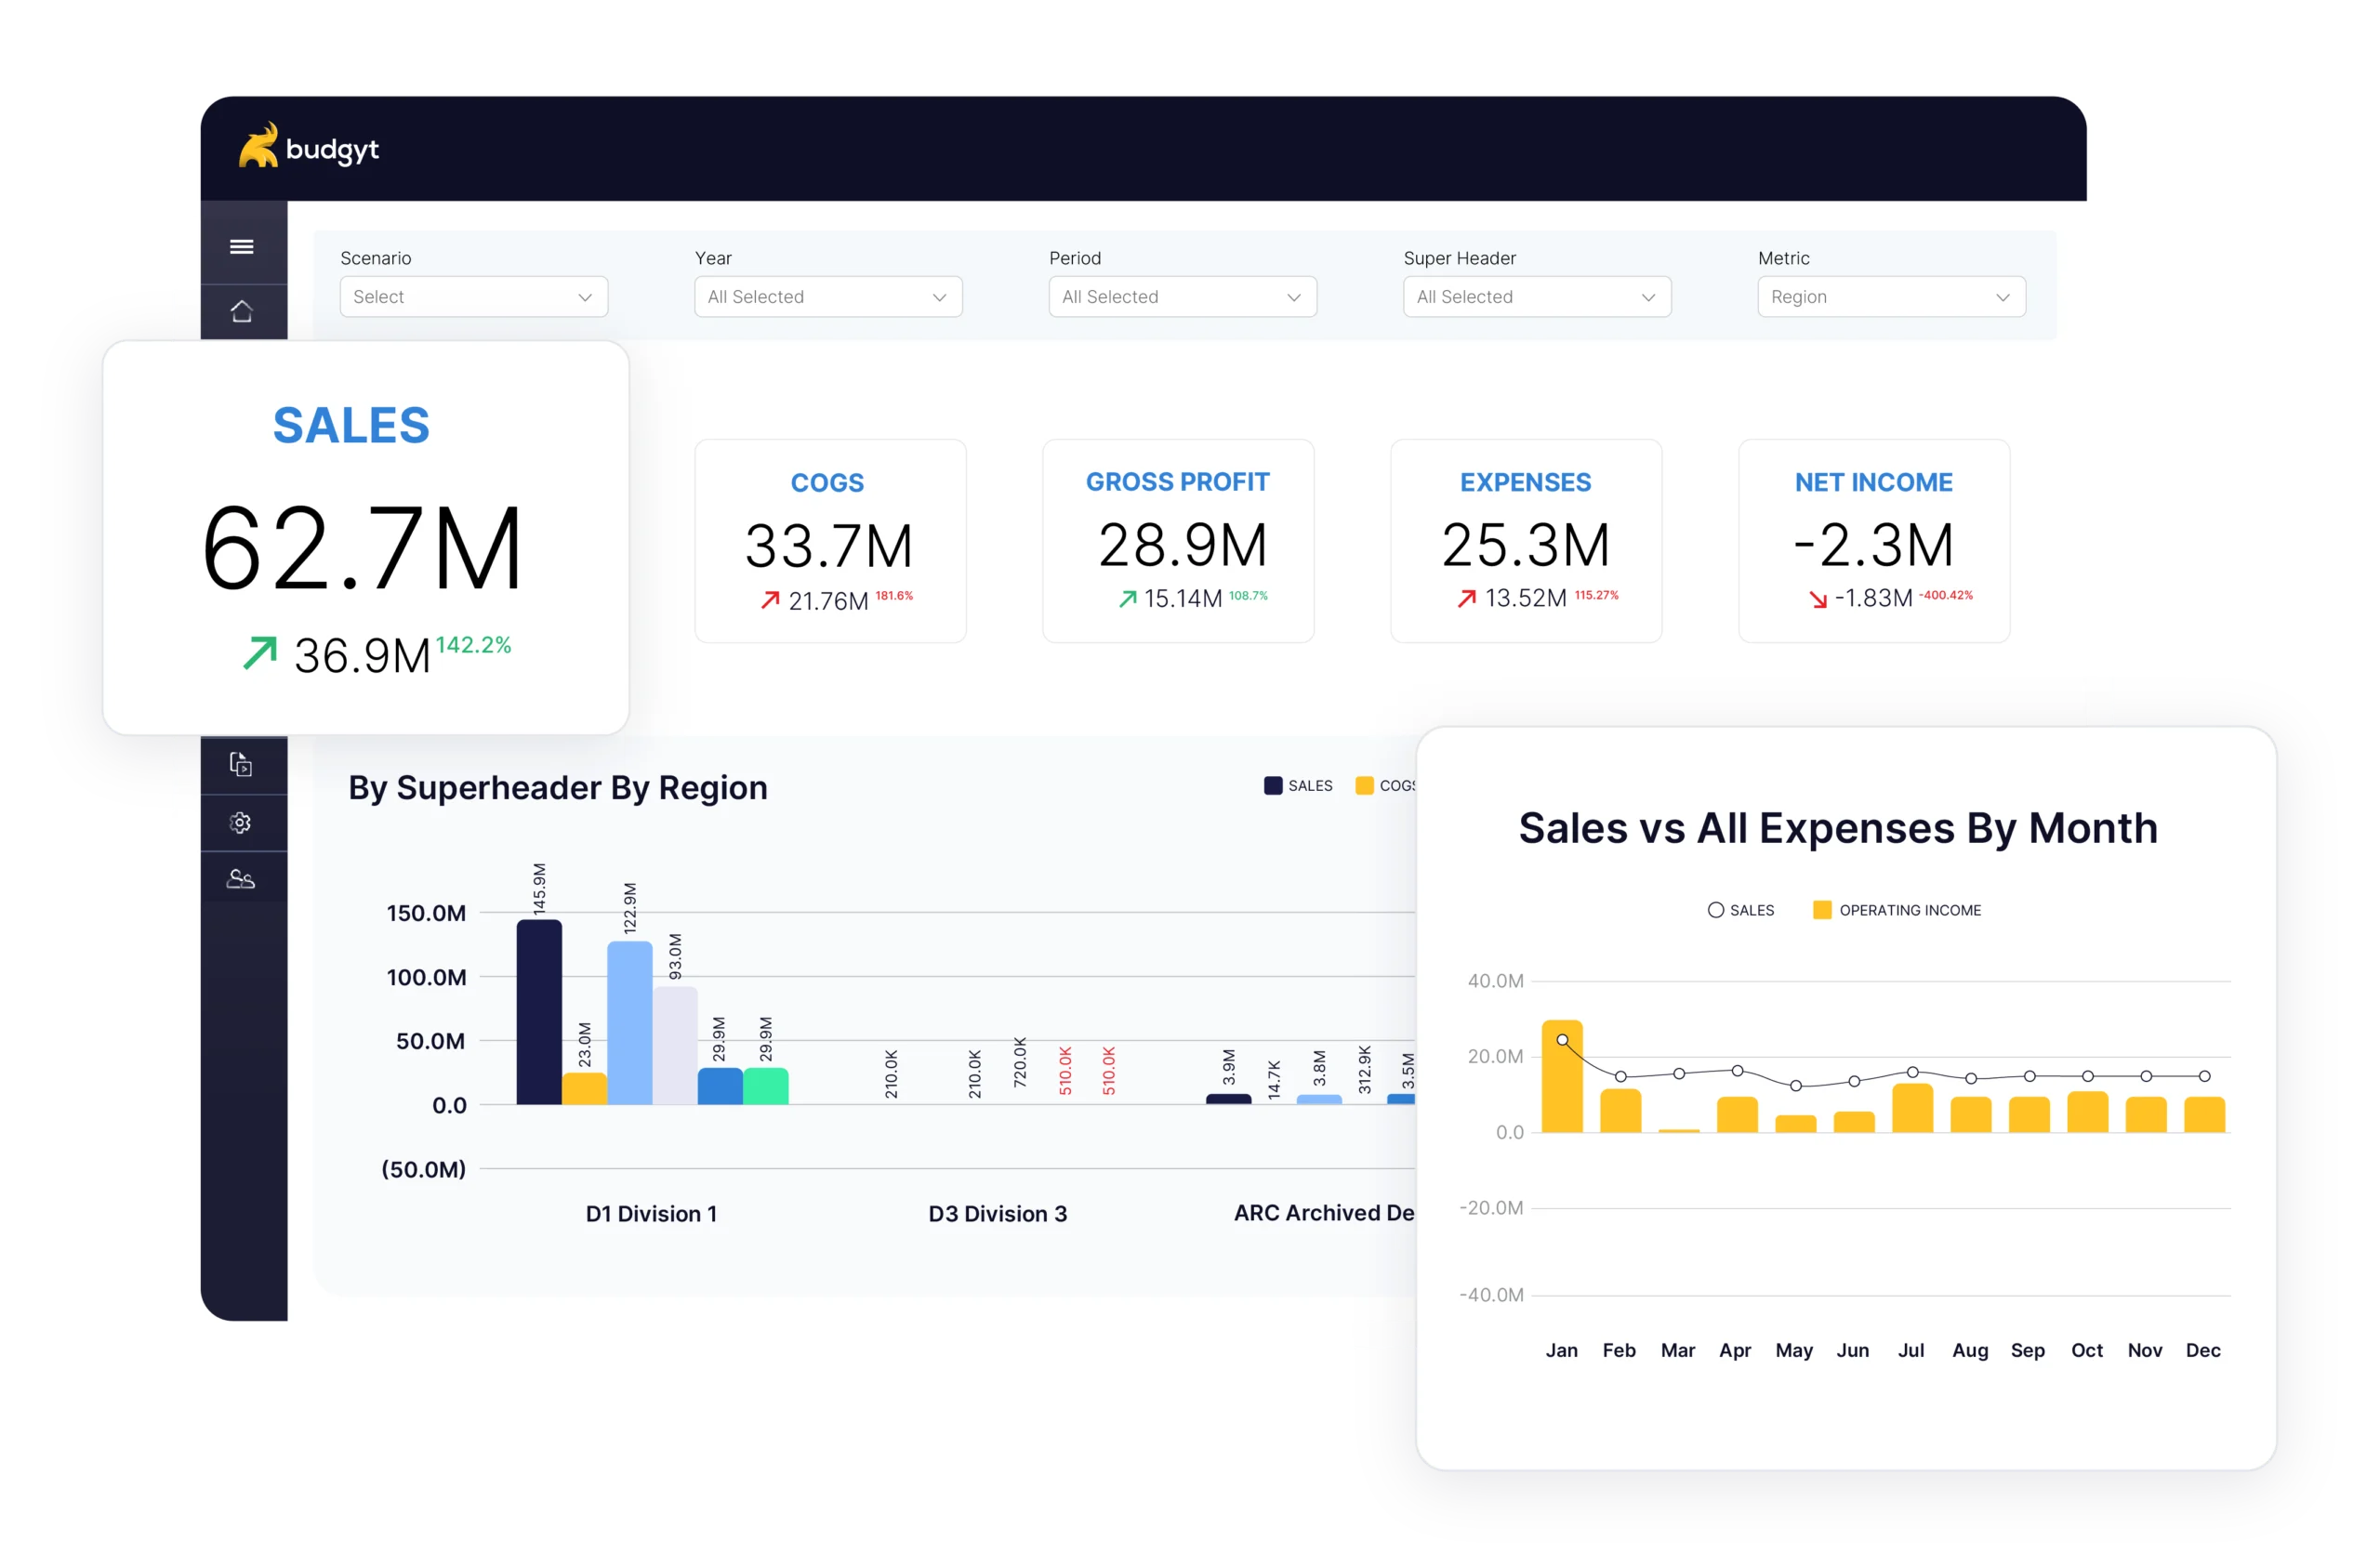
One nonprofit controller using Budgyt put it directly: she said she would buy budgeting software for the visualizations alone because her board could finally see the cash position clearly. That had not been possible before. The numbers were there. The clarity was not.
Most effective nonprofit financial reports share a few characteristics.
At the summary level, they cover organizational financial health: total revenue, total expenses, operating surplus or deficit, and cash position. Board members who serve on multiple boards can scan this quickly and orient themselves before the meeting.
Breaking out budget versus actual by major program or funding stream, rather than presenting only in aggregate, makes the report more useful to more people on the board. A board member representing a specific program wants to see how that program is performing. A member focused on fundraising wants to see revenue actuals against targets. Showing everything at the top level without any segmentation makes the report less useful to more people.
Calling out variances explicitly, rather than leaving board members to calculate them, is one of the highest-value things a finance team can do in a board report. If program expenses are 12% over budget through the first half of the year, say that. Include a brief narrative on the reason. Whether it is a timing difference, an unexpected cost, or a genuine budget problem determines whether the board needs to act or simply note it.
A grant tracking summary, showing each active grant, its total budget, spending to date, remaining balance, and end date, gives the board the oversight information it needs in one place. It also signals that restricted funds are being managed with care.
Many nonprofits operate on delayed reimbursements, particularly those with government contracts. Showing cash position alongside receivables and anticipated inflows gives a more accurate picture of near-term financial stability than a balance sheet alone.
When a board member asks a question during the meeting, the answer should already exist in the data. If answering requires going offscreen to a different spreadsheet, or worse, saying you will follow up after you check the numbers, the problem is in the reporting infrastructure, rather than the slide deck.
Two things tend to distinguish finance teams that present well at board meetings. First, they have done the variance analysis in advance and prepared brief explanations for anything that looks anomalous. Second, the data they are presenting from is accurate and current, not manually assembled the night before.
For most nonprofit finance teams, this preparation falls on a small number of people. In many organizations, the director of finance is also the controller, the grant accountant, and the person who handles audit requests. Board reporting should not consume an entire week of that person’s time every quarter.
When the budget system rolls up automatically, when actuals import on demand, and when variance analysis is available without building it from scratch, the board report goes from a project to a task. The finance director can focus on the narrative rather than the data reconciliation.
A financial report earns its credibility after the presentation, when follow-up questions come in and you can answer them without saying you will check and get back to them.
Your ability to answer those questions in the room, with specifics, is what builds the board’s confidence in finance leadership. Polished slides help, but confidence comes from having a system where any number on the page can be explained by clicking through to its source.
If you are preparing for an upcoming board meeting and want to improve what you present, start with the questions you got last time. Any question you could not answer immediately in the previous meeting is an indicator that either the data was not visible in the report or you did not have quick access to the detail behind it.
From there, structure the next report around those gaps. Unclear restricted fund tracking calls for a grant summary table. Cash position questions suggest adding a cash flow view. Missing variance explanations are a signal to add a brief narrative column to the budget versus actual section.
Longer term, the structural question is whether your budgeting platform gives you the flexibility to build these reports without rebuilding them from scratch each quarter. If your current process relies on someone manually assembling data across multiple spreadsheets, that is the constraint. Whatever system produces the data sets the quality ceiling for the report.
Boards are patient with complexity but not with inconsistency, data they cannot trust, or finance leaders who seem uncertain about their own numbers. Board-ready reporting depends on whether the data behind the report is solid enough to hold up to scrutiny, and that work happens well before anyone opens a slide deck.
You manage millions of dollars. You make decisions affecting dozens of employees. You report to boards with fiduciary responsibility.