Board-Ready Dashboards

Budgyt comes with professional dashboards built for how finance teams actually work:

P&L Executive Summary

Your revenue story and expense story side by side. KPIs across the top – revenue, COGS, gross profit, operating income, net income – with scenario comparisons at a glance. Revenue by division, expenses by category, and operating income trends all in one view.

Balance Sheet & Cash Flow

Full balance sheet with scenario comparison and prior year. Net cash flow waterfall charts showing what’s increasing your cash each month. Overall cash balance trending over time. AR/AP ratios, DSO, DPO – the metrics that matter.

Powerful Filtering

Compare Any Scenario. Filter to Any Level.

Every Budgyt dashboard lets you slice your data exactly how you need it:

Scenario Comparison

Compare this year’s budget to last year. Or Actuals to Forecast. Or any two scenarios you’ve built. See the variance instantly.

Filter by Anything

Isolate by division, region, department, or entity. Filter to specific periods. Roll up by group or drill into the detail. Consolidate however makes sense for your organization.

See What You Need to See

Stop scrolling through irrelevant data. Filter to your division, your department, your time period – and see exactly what matters.

Three Ways to Get Started

Your Dashboard, Your Way

Everyone wants something slightly different. That’s why we give you options:

Use Our Templates

Start with Budgyt’s standard dashboard templates. P&L summaries, balance sheets, trend analysis – professional layouts ready to go.

Build It Yourself

Create custom visualizations using Budgyt’s tools. Arrange your data exactly how you want to see it, in tabular or visual format.

Let Us Build It For You

Have something specific in mind? Share an example – a PDF, an Excel file, a screenshot, whatever you’ve got – and we’ll recreate it in Budgyt. Quick turnaround, exactly what you need.

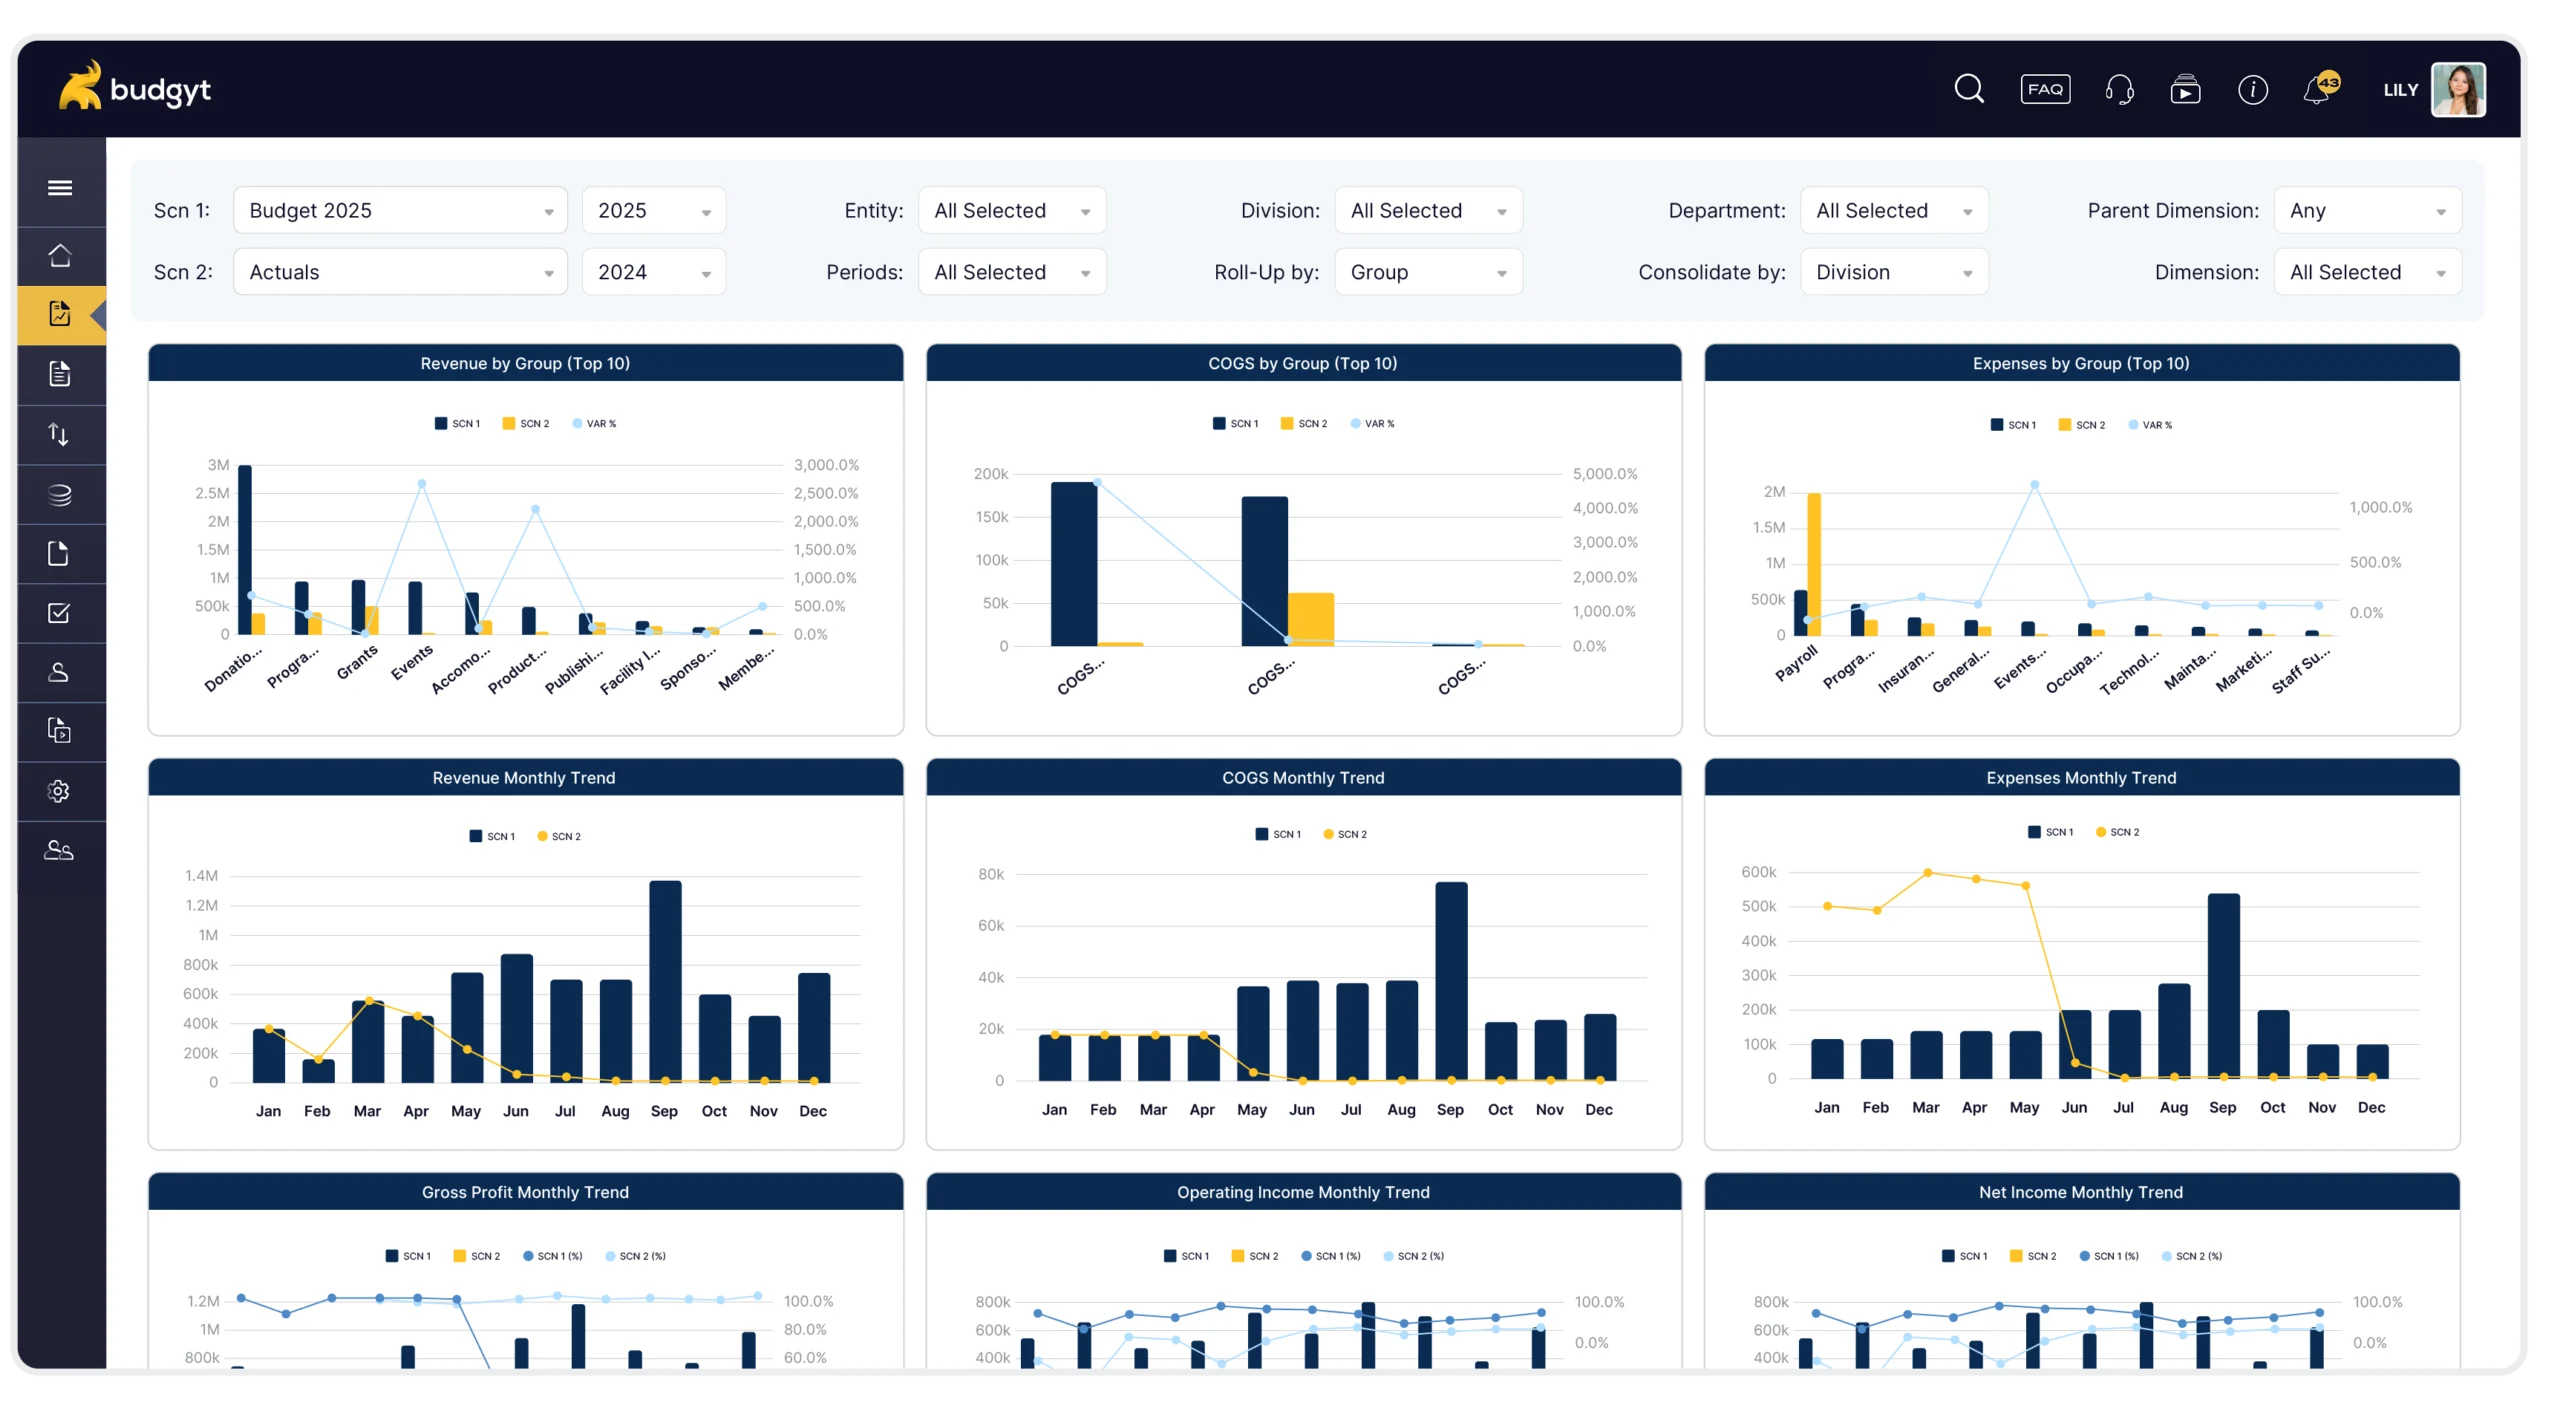
Zero Maintenance Required

Add a Category. Change Your Structure. It Just Works.

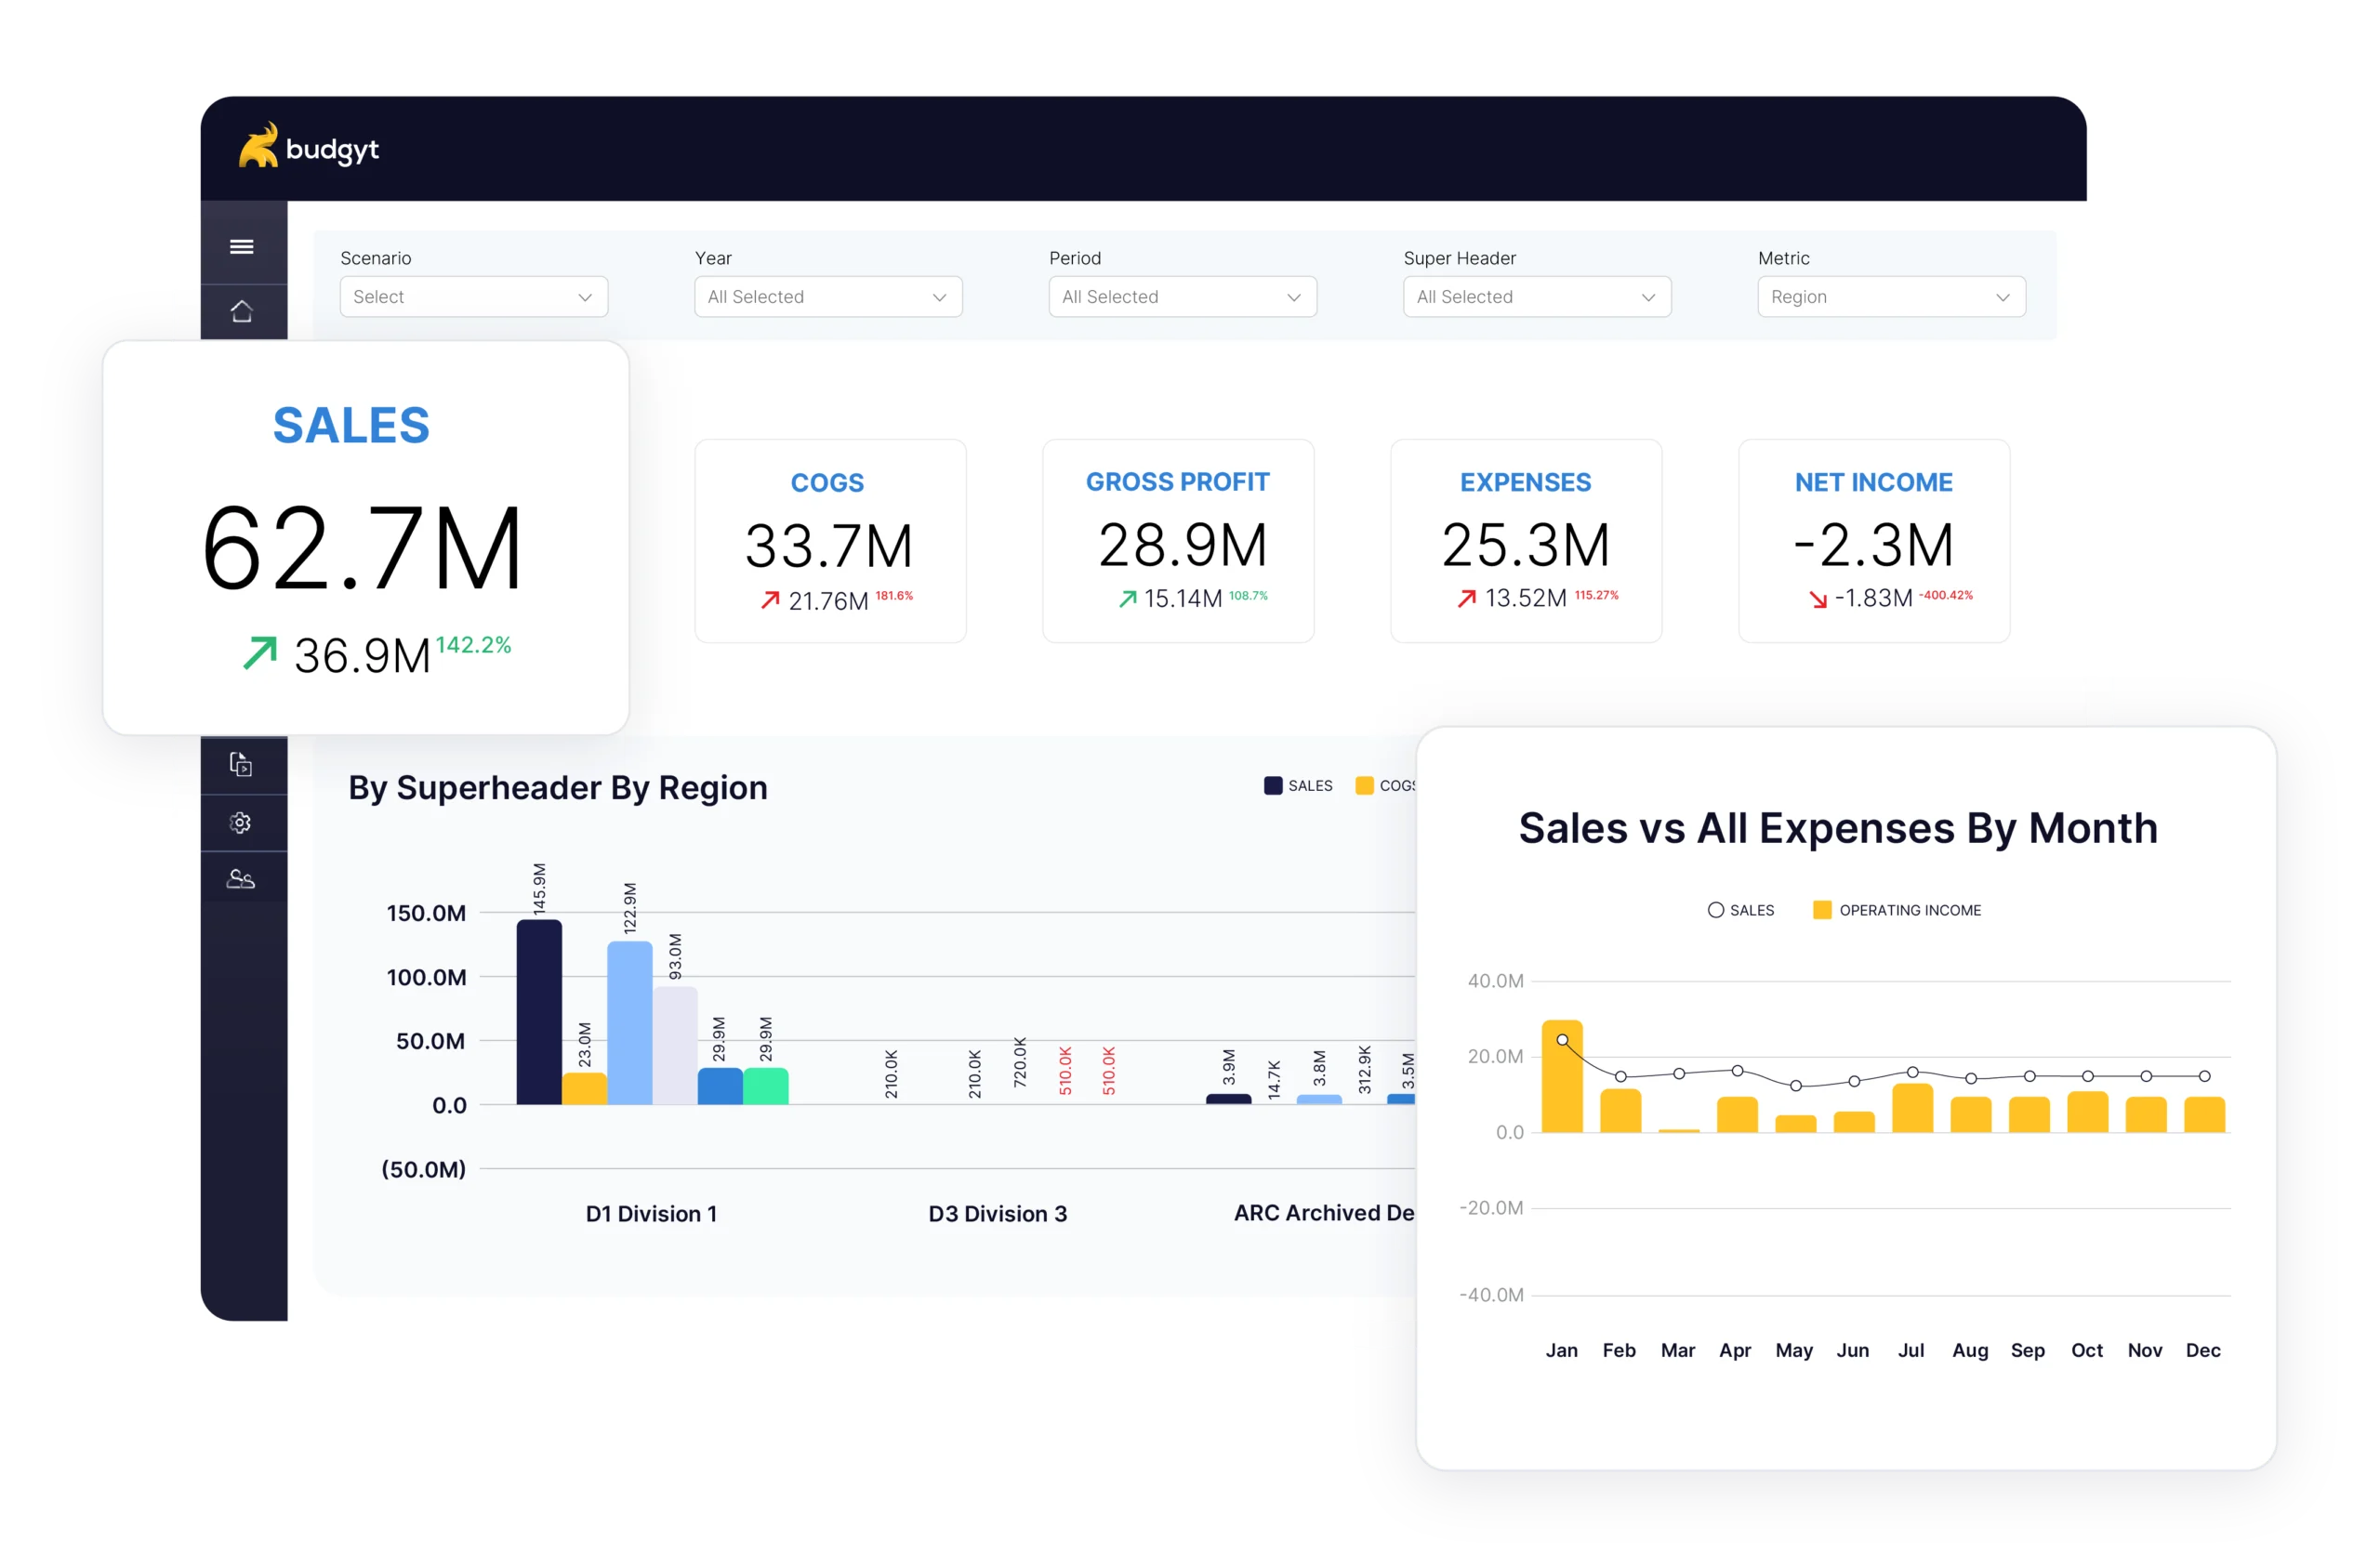
Here’s what makes Budgyt different: your dashboard reads directly from your database settings. There’s nothing to maintain.

Add a new department? Your dashboard updates automatically. Add a new expense category? Already there. Change your chart of accounts structure? Everything adjusts.

No broken formula links to hunt down. No data source verification rituals. No calling support to reconnect your reports. No consultant fees every time your organization evolves.

Your dashboard just works. Month after month. Year after year.

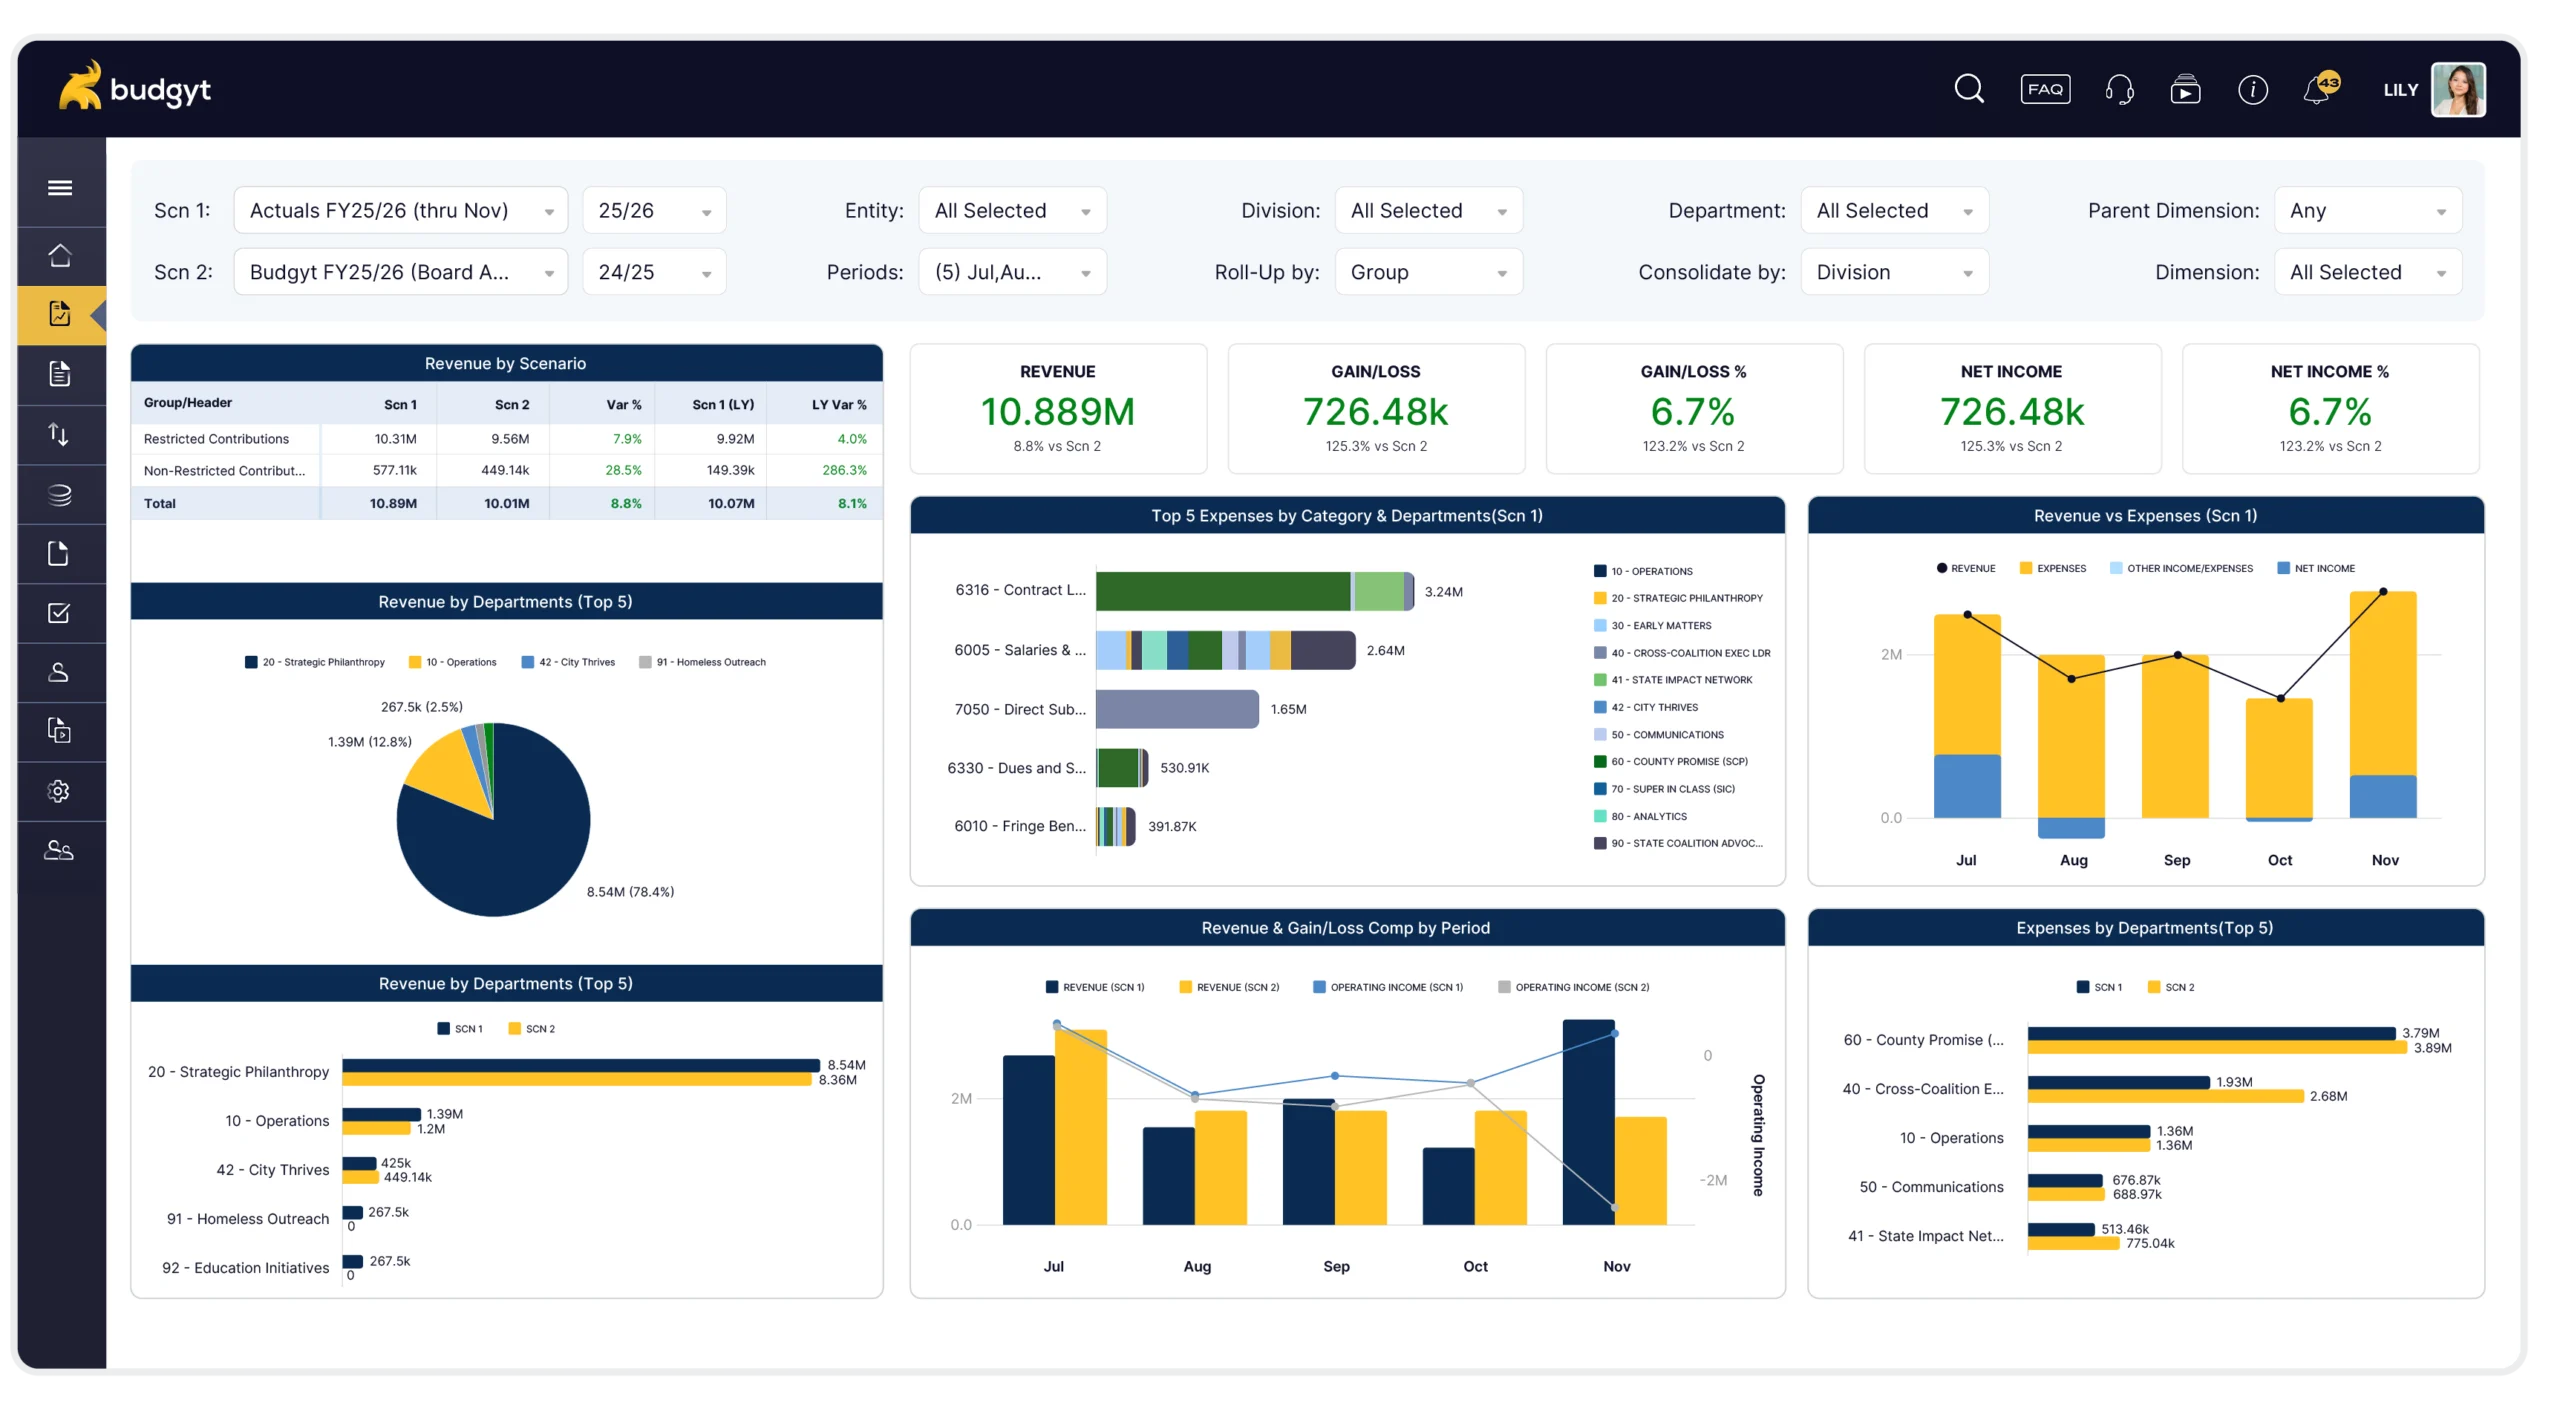
Instant Scenario Updates

Monthly Updates in Seconds, Not Hours

Remember spending hours updating your Excel reports every month? Verifying every chart is pulling the right data? Making sure actuals replaced budget in the right places?

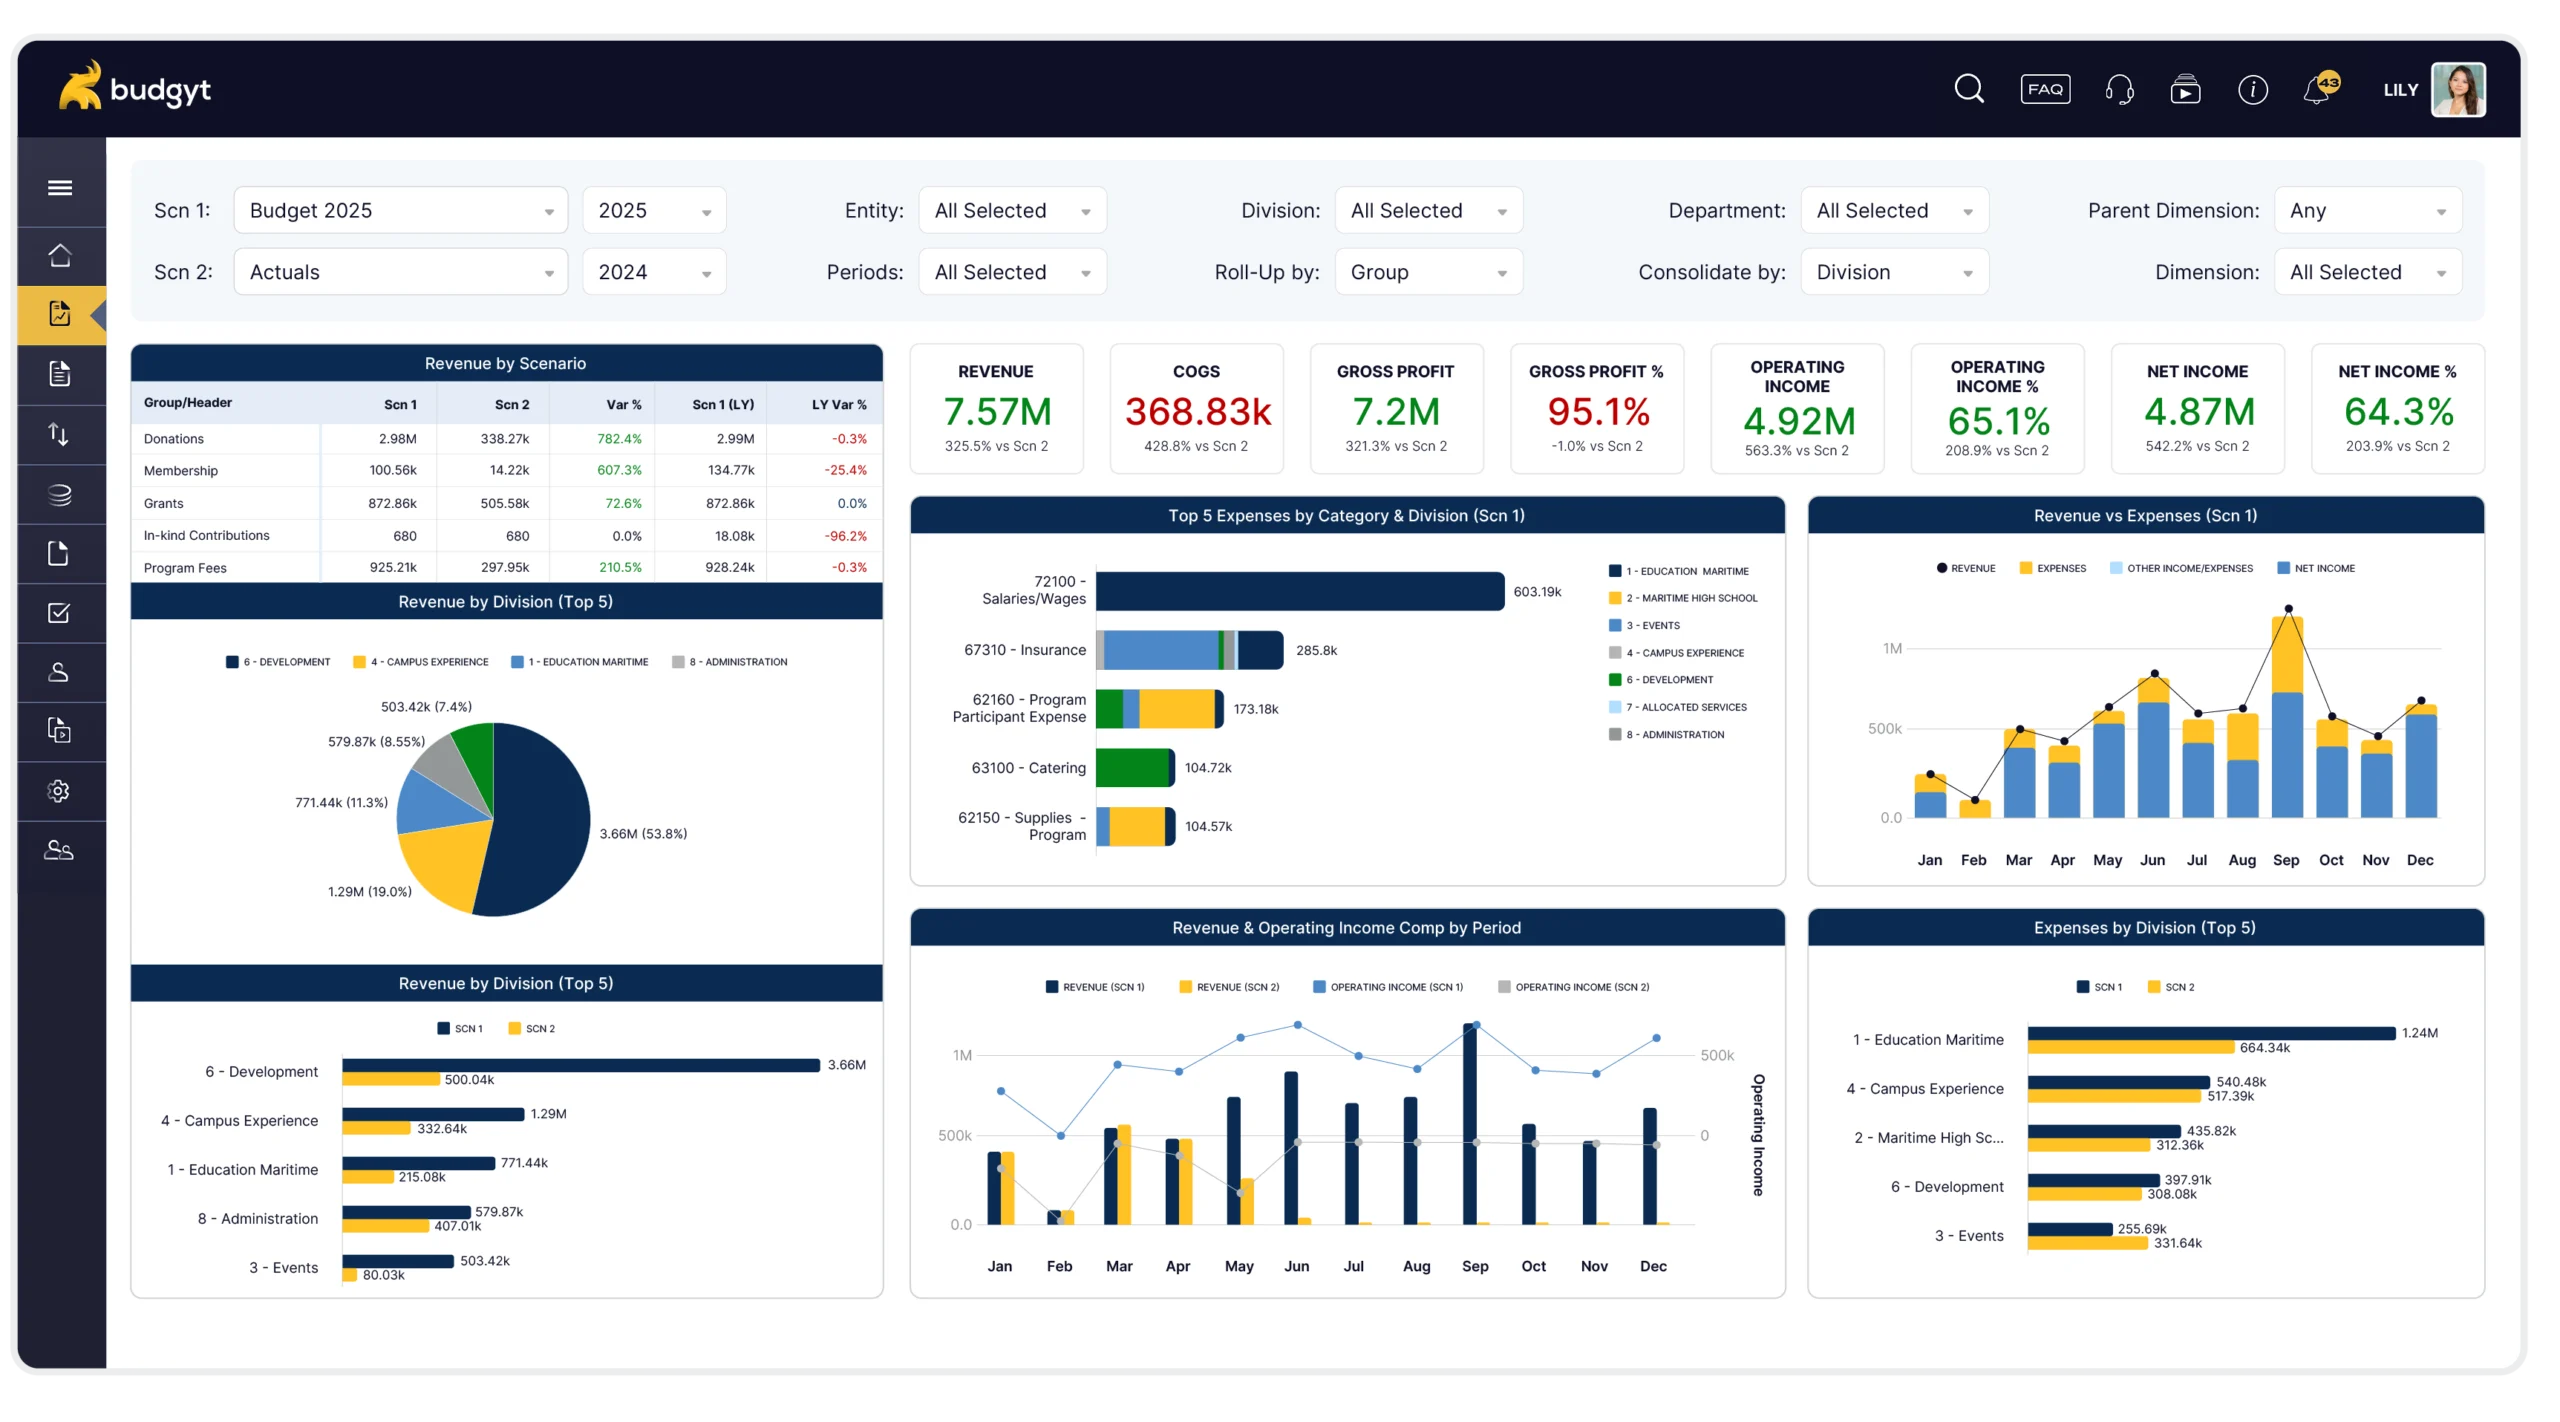
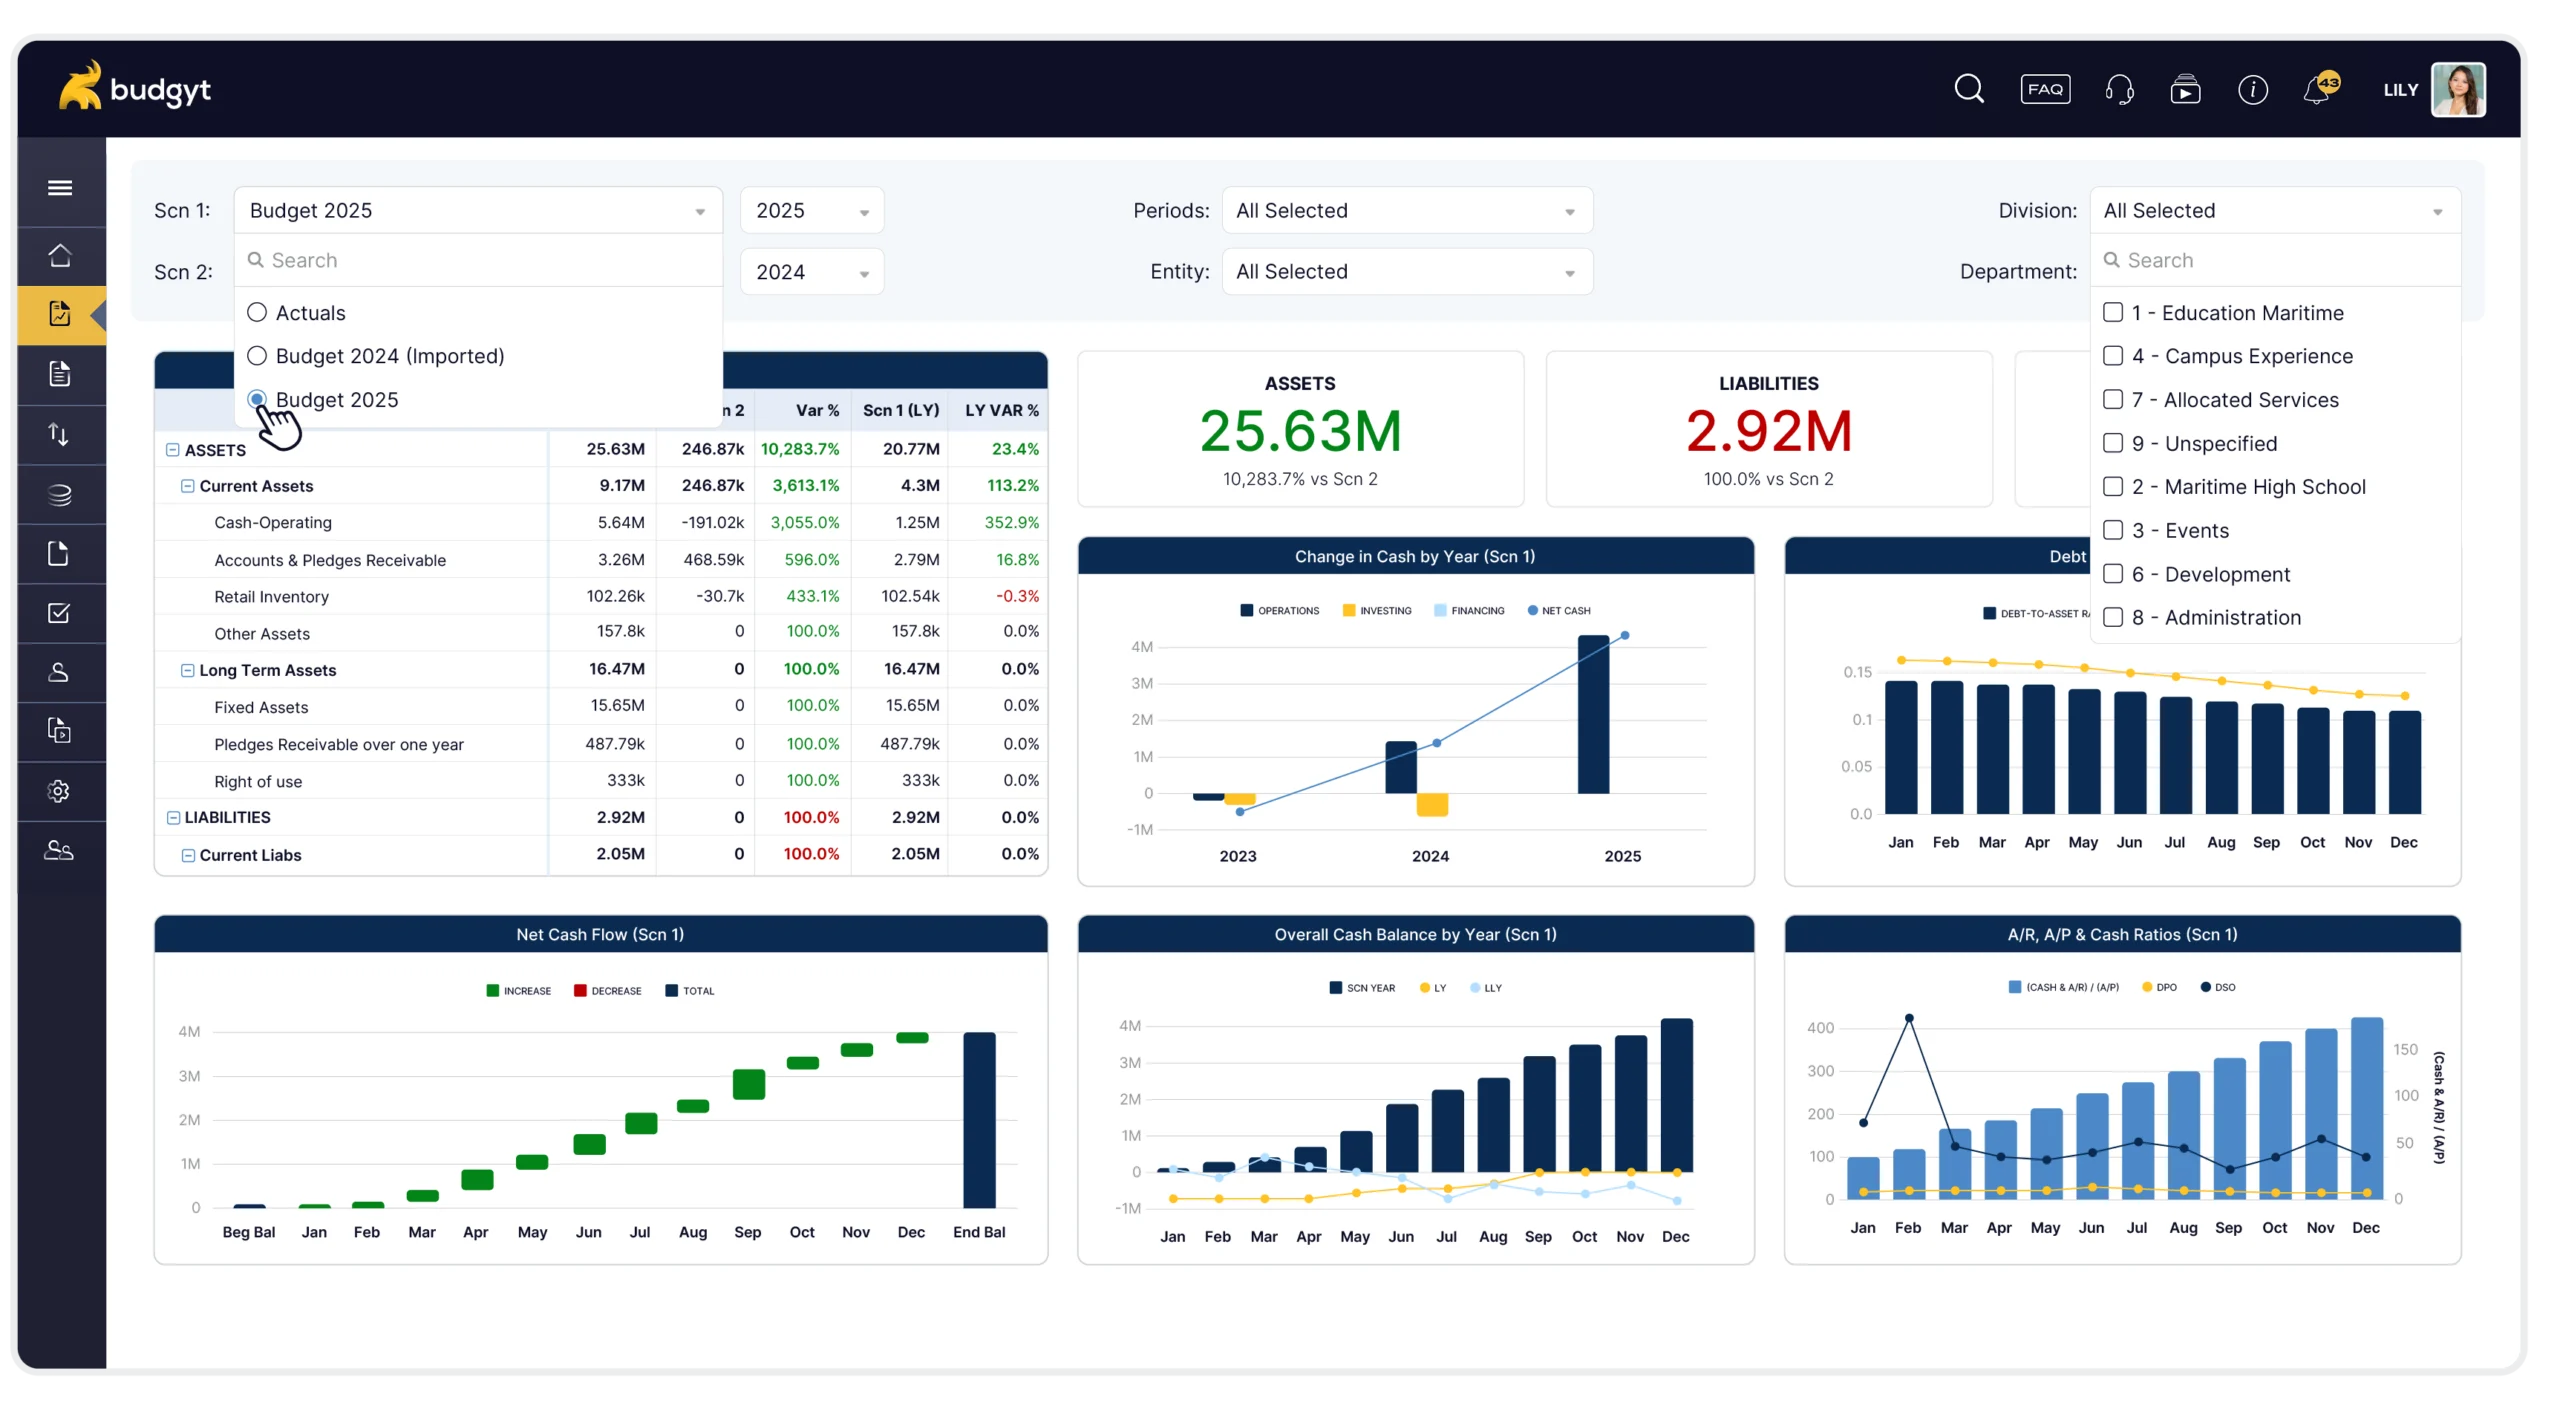
In Budgyt, you change the scenario dropdown. That’s it.

Switch from Budget to Actuals, compare to prior year, see the variance in the trend – all with a single click. Every chart, every table, every KPI updates instantly.

What used to take hours now takes seconds.

Explore All Budgyt Features

See how Budgyt supports your complete budgeting lifecycle

Build

Create bulletproof budgets with your entire team.

Learn more

Analyze

Drill down into performance with granular analysis

Learn more

Reforecast

Update forecasts monthly with rolling scenarios.

Learn more

Integrations

Connect seamlessly with leading accounting platforms.

Learn more

Support

Same-day support and comprehensive training

Learn more

Security

Enterprise-grade security you can trust.

Learn more