Rolling Forecasts
Three months actual, nine months forecast, refreshed as funding shifts
Rolling forecasts, scenario planning, and board-ready reporting. Built for nonprofit finance teams that have outgrown spreadsheets but don’t need a six-month enterprise rollout.
Enterprise FP&A platforms were built for finance teams of ten or more, with dedicated FP&A analysts, six-month implementation cycles, and seven-figure software budgets. Most nonprofit finance teams are three to five people doing work of the same shape at a scale that doesn’t justify enterprise tooling.
FP&A capability built for nonprofit finance teams, without the enterprise overhead.


Plenty of nonprofit finance teams do FP&A work without calling it that. Nonprofit FP&A means moving beyond a static annual budget into rolling forecasts, scenario planning, grant-aware planning, variance analysis, and board-ready reporting, the ongoing planning that keeps the numbers current as funding changes through the year.
| FP&A capability | What it means for a nonprofit |
|---|---|
| Rolling forecasts | Update the outlook as actuals and funding change, instead of once a year |
| Scenario planning | Model different grant and funding outcomes side by side |
| Grant-aware planning | Plan with payroll and costs allocated across grants |
| Variance analysis | Compare the budget to actuals and explain the gap |
| Board-ready reporting | Produce the consolidated view your board expects |
The shape of nonprofit FP&A work is the same as any mid-market finance function: rolling forecasts, scenario planning, variance analysis, and board reporting. The difference lies in the underlying structure, and that’s where most platforms struggle.
A nonprofit running grant-funded programs needs a payroll allocation that holds up to a funder audit, reforecasting that doesn’t require rebuilding the model every time a grant changes mid-year, and board visibility into restricted versus unrestricted funds in the same system that runs the budget, rather than in a separate report.
Enterprise FP&A platforms can be configured to do this. Most nonprofits can’t justify the cost of configuration.
Learn more about Grant Budgeting Software
A side-by-side view of the before and after replacing spreadsheets with Budgyt
| Finance task | Before Budgyt | With Budgyt |
|---|---|---|
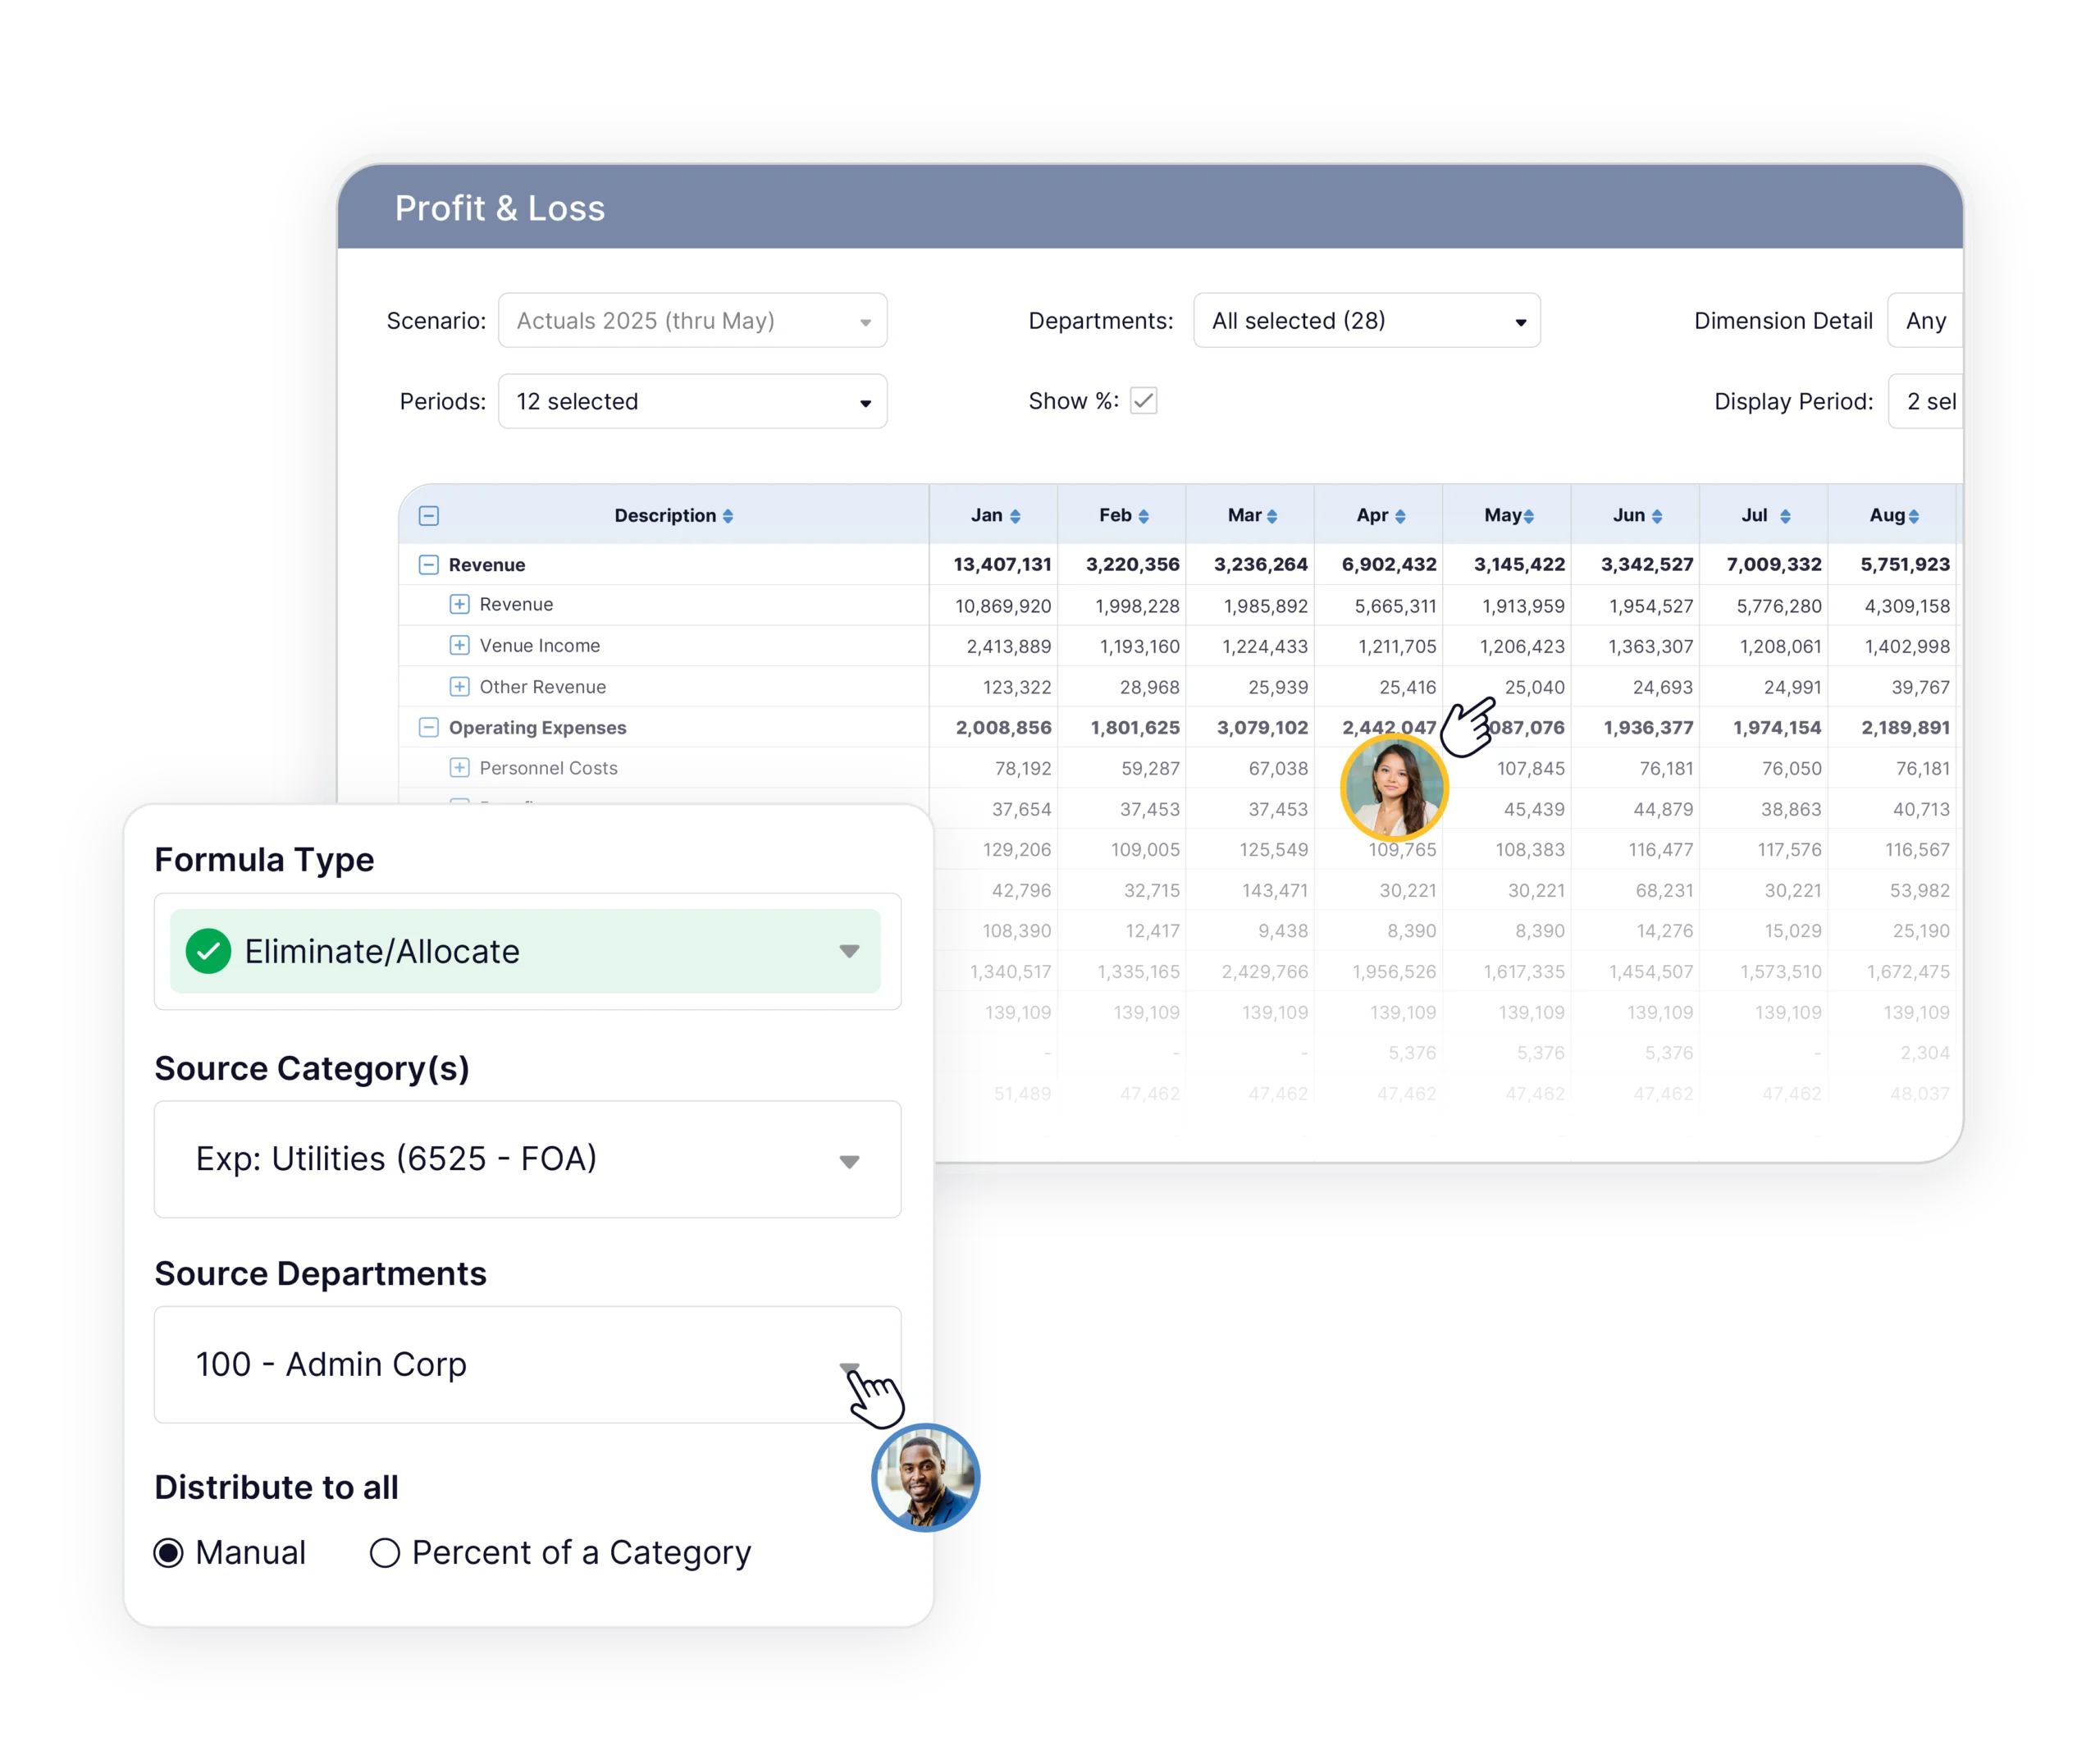
| Reforecast after a grant change | Rebuild the spreadsheet model, re-key allocations, version chase | Adjust the scenario, allocations update, board pack regenerates |
| Payroll allocation across grants | Manual percentage splits in formulas are prone to breaking | Percentage splits set once, defensible in audit |
| Budget input from program directors | Email spreadsheets out, consolidate multiple versions | Directors enter directly, role-based permissions |
| Board reporting | Hand-built deck pulled from multiple files | Pre-built dashboard with variance commentary |
| Variance analysis | Pivot tables, copy-paste actuals | Actuals imported on demand, variance calculated live |
Budgyt is FP&A software designed for nonprofit finance teams. The structural capability you need, without the implementation team, the per-user pricing, or the platform overhead built for a different kind of organization.
Three months actual, nine months forecast, refreshed as funding shifts
Percentage-based payroll splits across employees and programs are defensible in an audit
Unlimited scenarios for different grant and funding outcomes, each with a full working budget
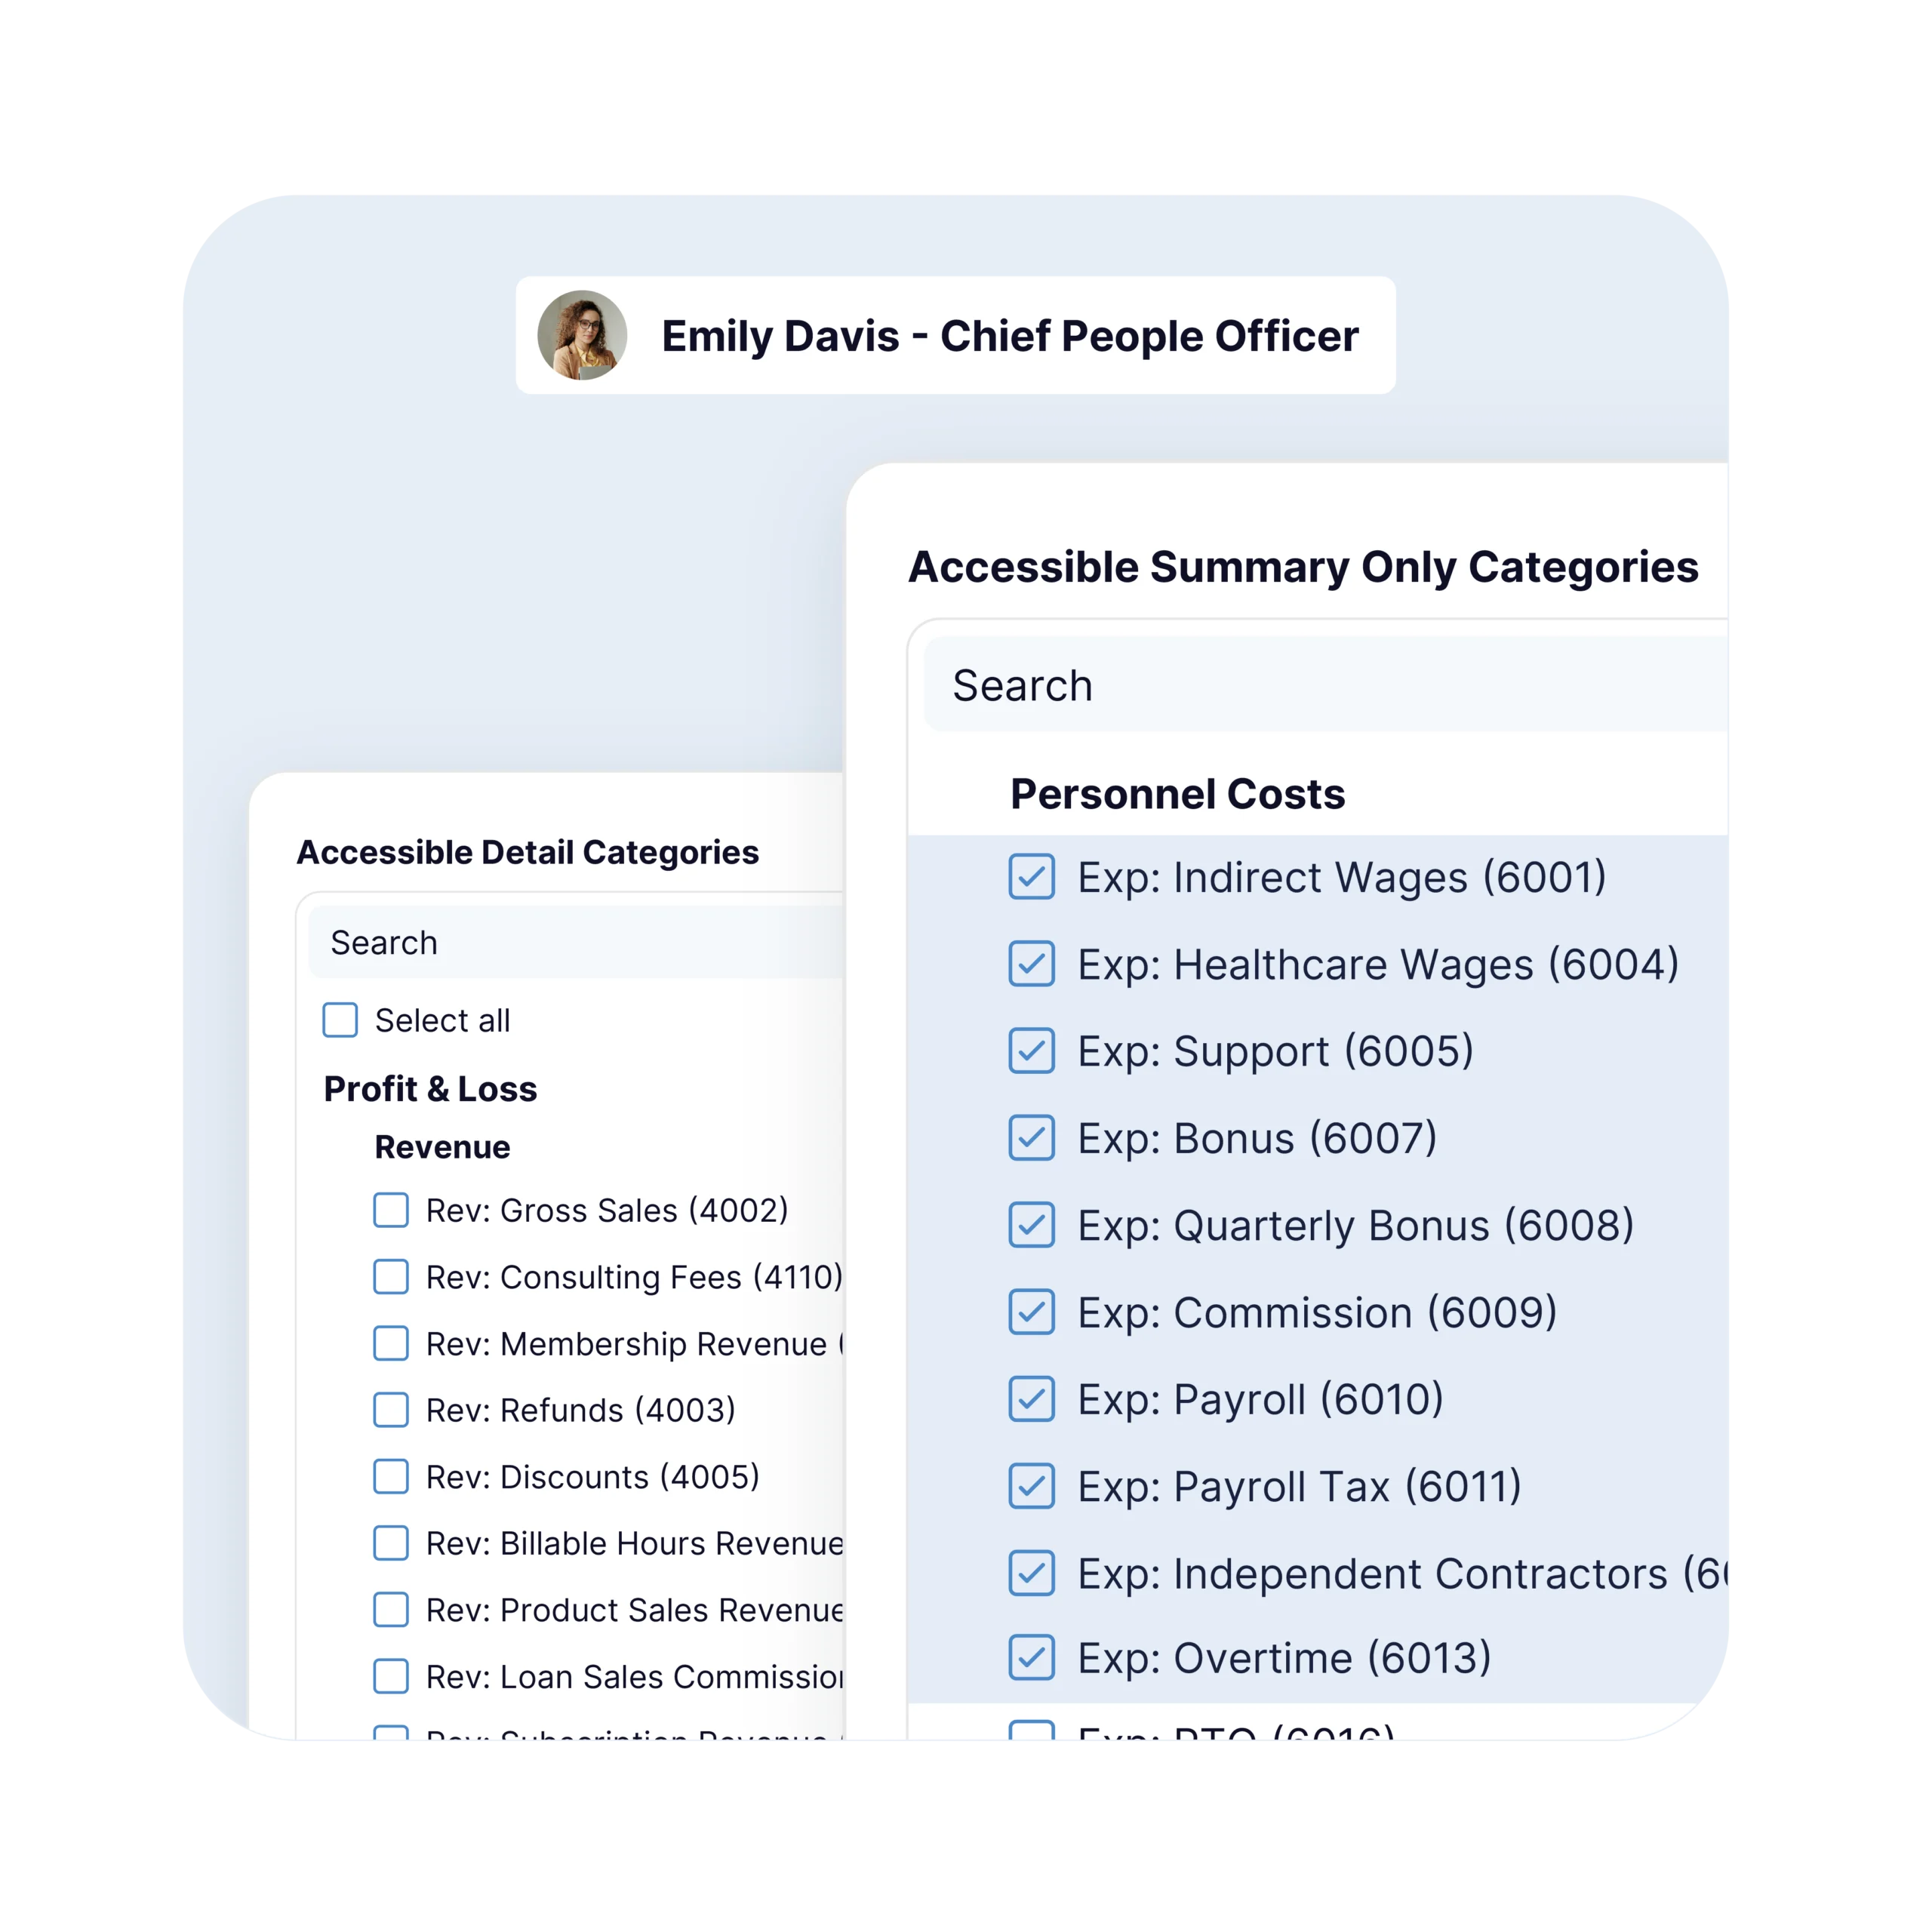
Unlimited users across programs and entities, with role-based permissions
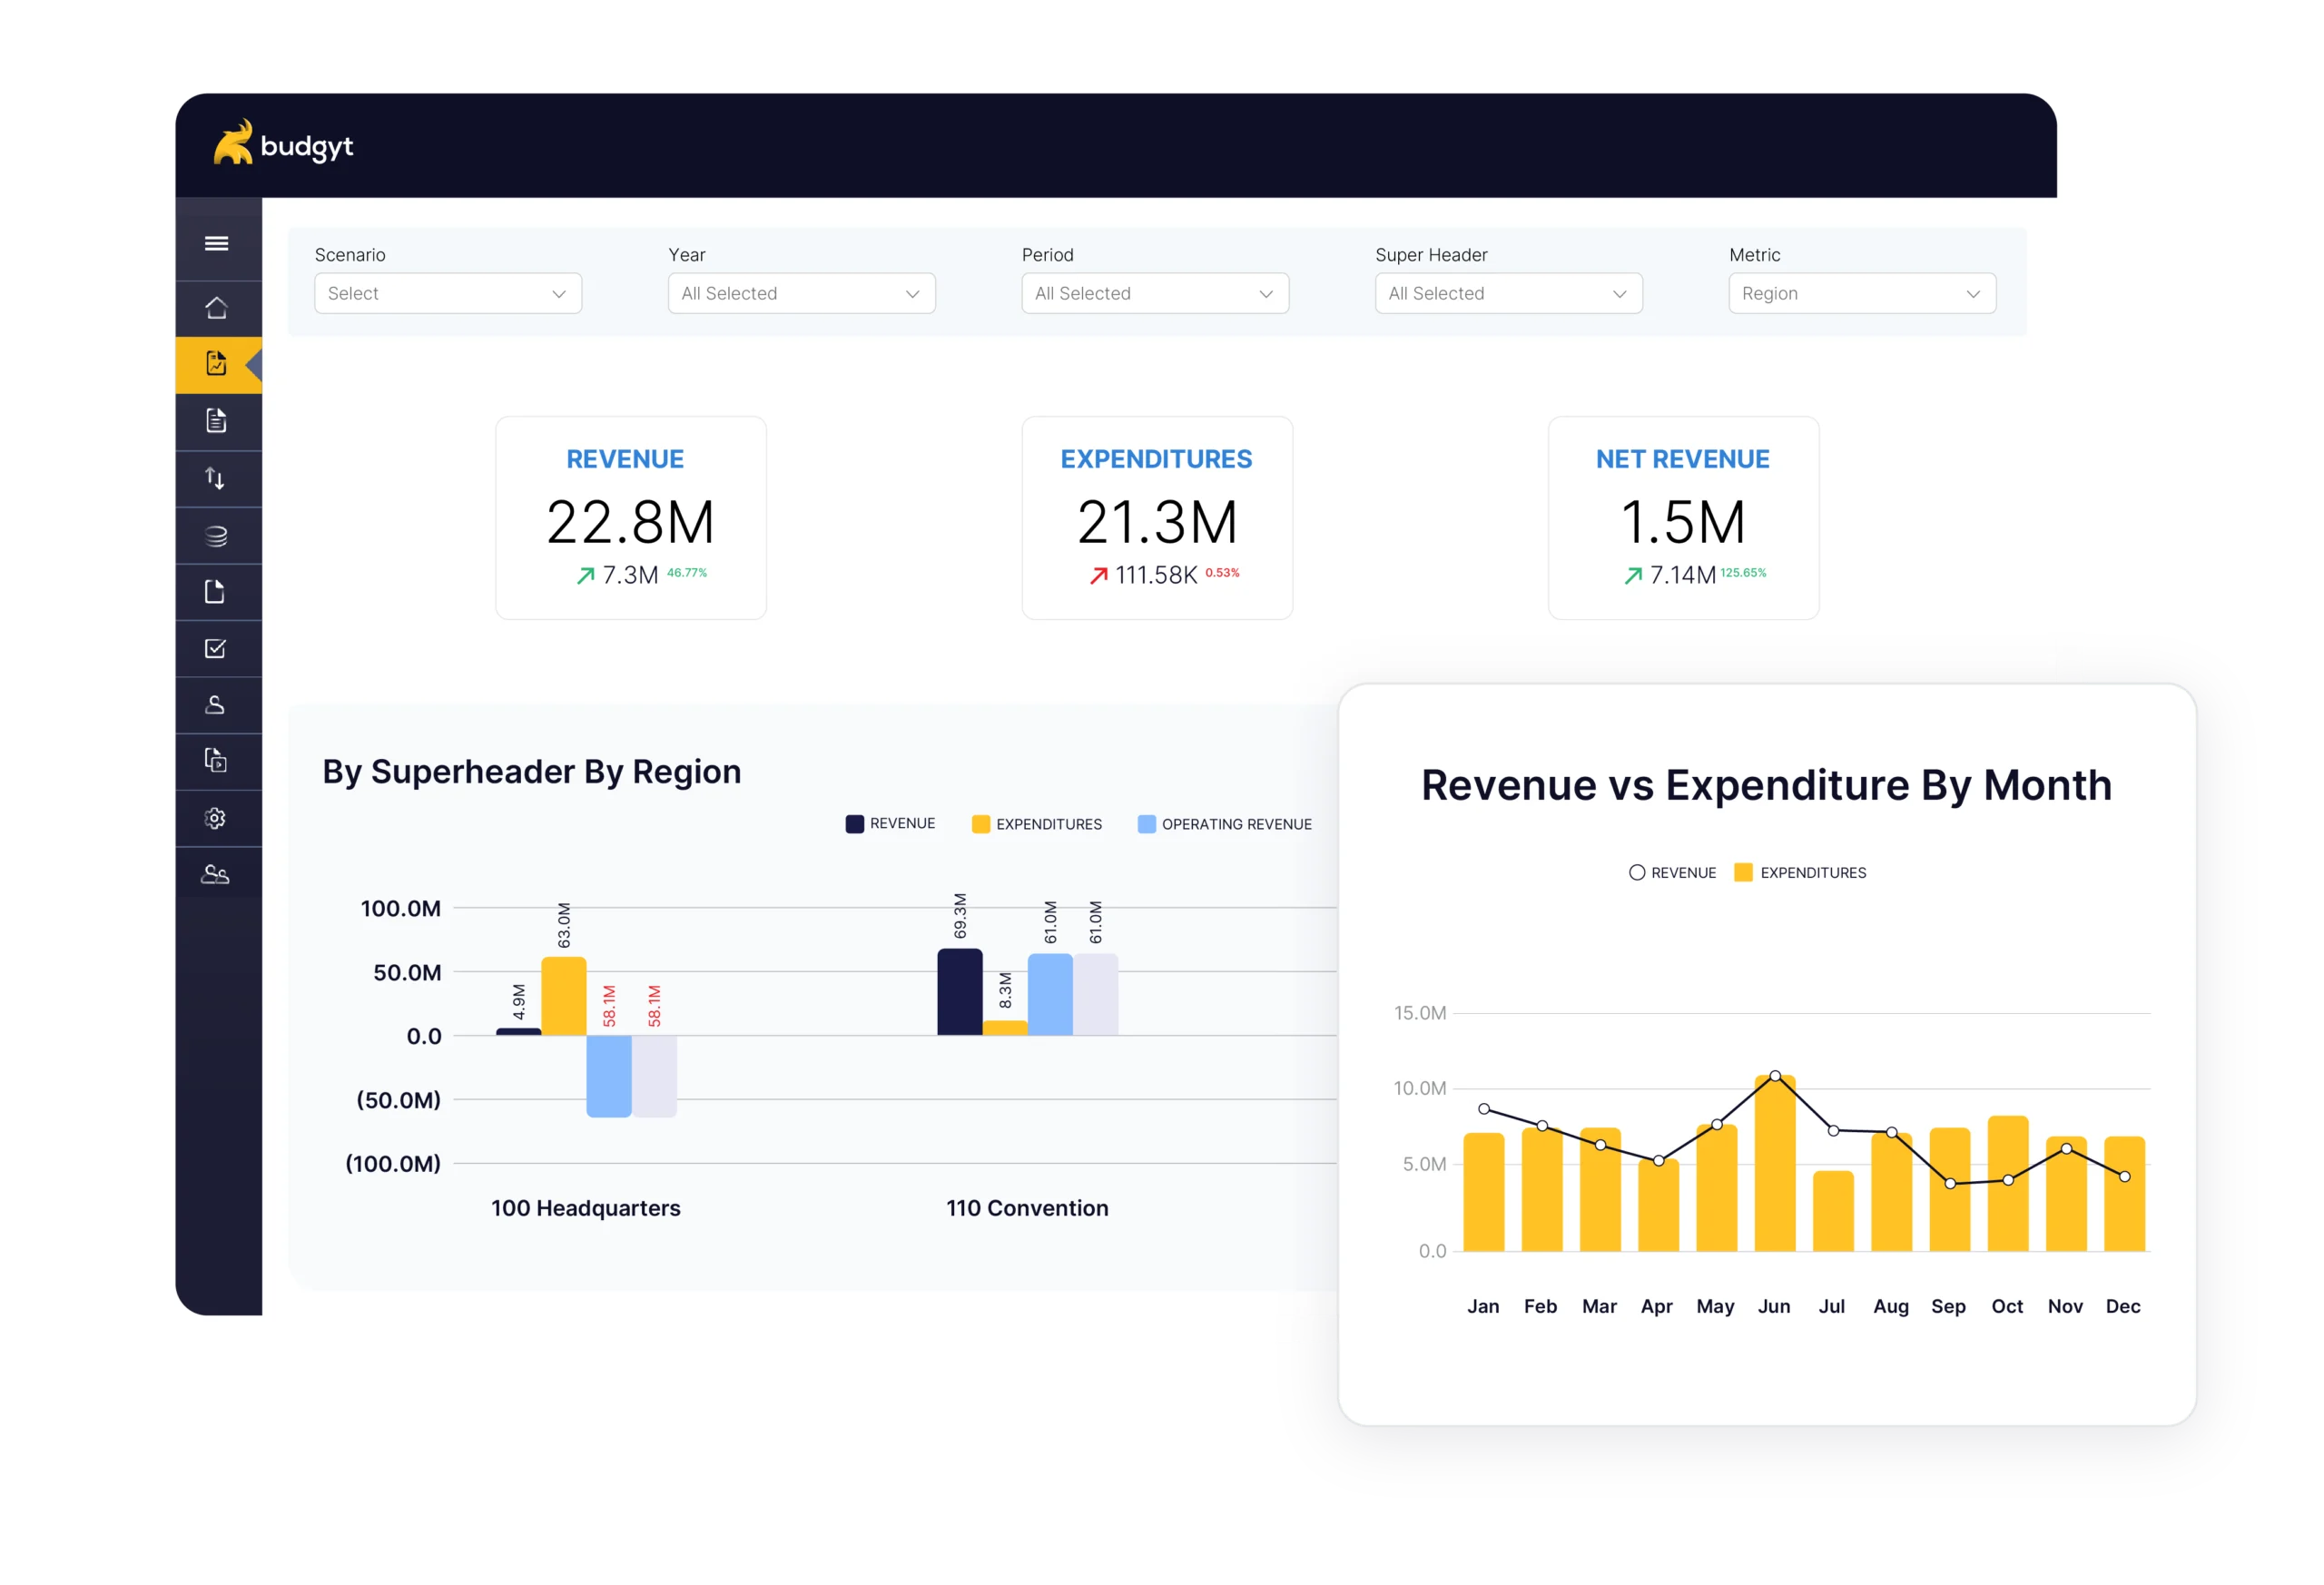
Consolidated views with variance commentary and embedded visualizations
Direct integrations with QuickBooks, NetSuite, Sage Intacct, Business Central
For nonprofits running multiple programs, departments or entities, FP&A should involve the people closest to the work. Program directors know their staffing needs, department heads understand their costs, and finance owns the consolidation and reporting. All of them need a seat in the system.
That collaboration breaks down when FP&A software charges per user. Adding 10 program directors at $200 per seat pushes enterprise pricing past $25,000 per year before the first forecast runs.
Unlimited users at a flat rate means everyone who should be involved in the planning process can participate, with role-based permissions controlling what each person sees. For organizations running several entities or funds, those budgets roll up into one consolidated view, giving finance a single plan across the whole organization.
Enterprise FP&A platforms take three to six months to implement, often with separate professional services contracts and dedicated consulting teams.
A typical Budgyt onboarding takes two weeks. The accounting integration is set up on day one through a read-only API. You import your existing data, and the configuration work focuses on grant structure, chart of accounts, and the specific allocations your finance team uses: no consulting engagement, no separate professional services contract.
Enterprise FP&A platforms typically run $20,000 to $50,000 a year before implementation. Budgyt is $399 a month, $4,788 a year, with unlimited users. The difference comes down to three structural choices:
The product was built for mid-market organizations from the start, not scaled down from an enterprise stack. Infrastructure costs are lower.
Implementation doesn’t require a consulting team. Finance teams configure the platform themselves, with onboarding support included.
Unlimited users at a flat rate means no charge for collaboration. Enterprise platforms charge per seat, which pushes their effective cost up fast.
| Budgyt | Enterprise FP&A ($25K+) | |
|---|---|---|
| Annual cost | From $4,788 | $25,000–$50,000 |
| Implementation time | ~2 weeks | 3–6 months |
| Procurement process | Below most thresholds | Full RFP, board approval |
| User pricing | Unlimited | Per-user |
| Multi-grant allocation | Native | Often custom-built |
| Nonprofit-specific features | Standard | Configurable |
| Suitable for | Nonprofit finance teams | Enterprise FP&A teams |
Budgyt provides our leaders with an easy, self-service interface for their financial data. It empowers them to do their own analysis and saves the finance team a lot of time answering questions.
Both our finance team and our budget discussions have been dramatically more efficient. Automatic consolidation on the cloud allows our decision makers to view bottom-line impacts in real-time for much more strategic business planning.
We rely on a flexible approach to managing our finances, so it is critical to have data organized and presented the way we need it. Budgyt is highly customizable and can fit most, if not any, account structure.
Budgeting software builds the annual budget. FP&A software handles ongoing financial planning through the year: rolling forecasts, scenario modeling, variance analysis, and management reporting. Budgyt does both in the same system.
Enterprise FP&A platforms are built for finance teams with dedicated FP&A staff and a budget of $25,000-plus a year. Budgyt covers the FP&A capability most nonprofits use, including rolling forecasts, scenario planning, variance analysis, and multi-grant allocation, at a price a finance director can approve directly.
QuickBooks is an accounting system. It records what happened. Budgyt is FP&A software that integrates with QuickBooks and handles planning: rolling forecasts, scenario modeling, grant allocation, and board reporting. The two work together.
Two weeks on average. You send us your existing budget files and chart of accounts. We map them into Budgyt, set up your allocations, and walk you through the system. A dedicated Customer Success Manager stays with you through the first budget cycle.
Yes. Unlimited scenarios are included. Build a base case, an upside, a conservative case, or any number of scenarios reflecting different grant outcomes. Each scenario is its own working budget with full reporting.
Yes. Direct integrations with QuickBooks Online, NetSuite, Sage Intacct, and Microsoft Dynamics 365 Business Central. Manual GL import is also supported for other systems.
Pre-built dashboards and embedded visualizations are designed for board presentation. Custom dashboards let you build views specific to your board’s reporting expectations. Variance commentary sits alongside the numbers, so context is in the report, not in a separate document.