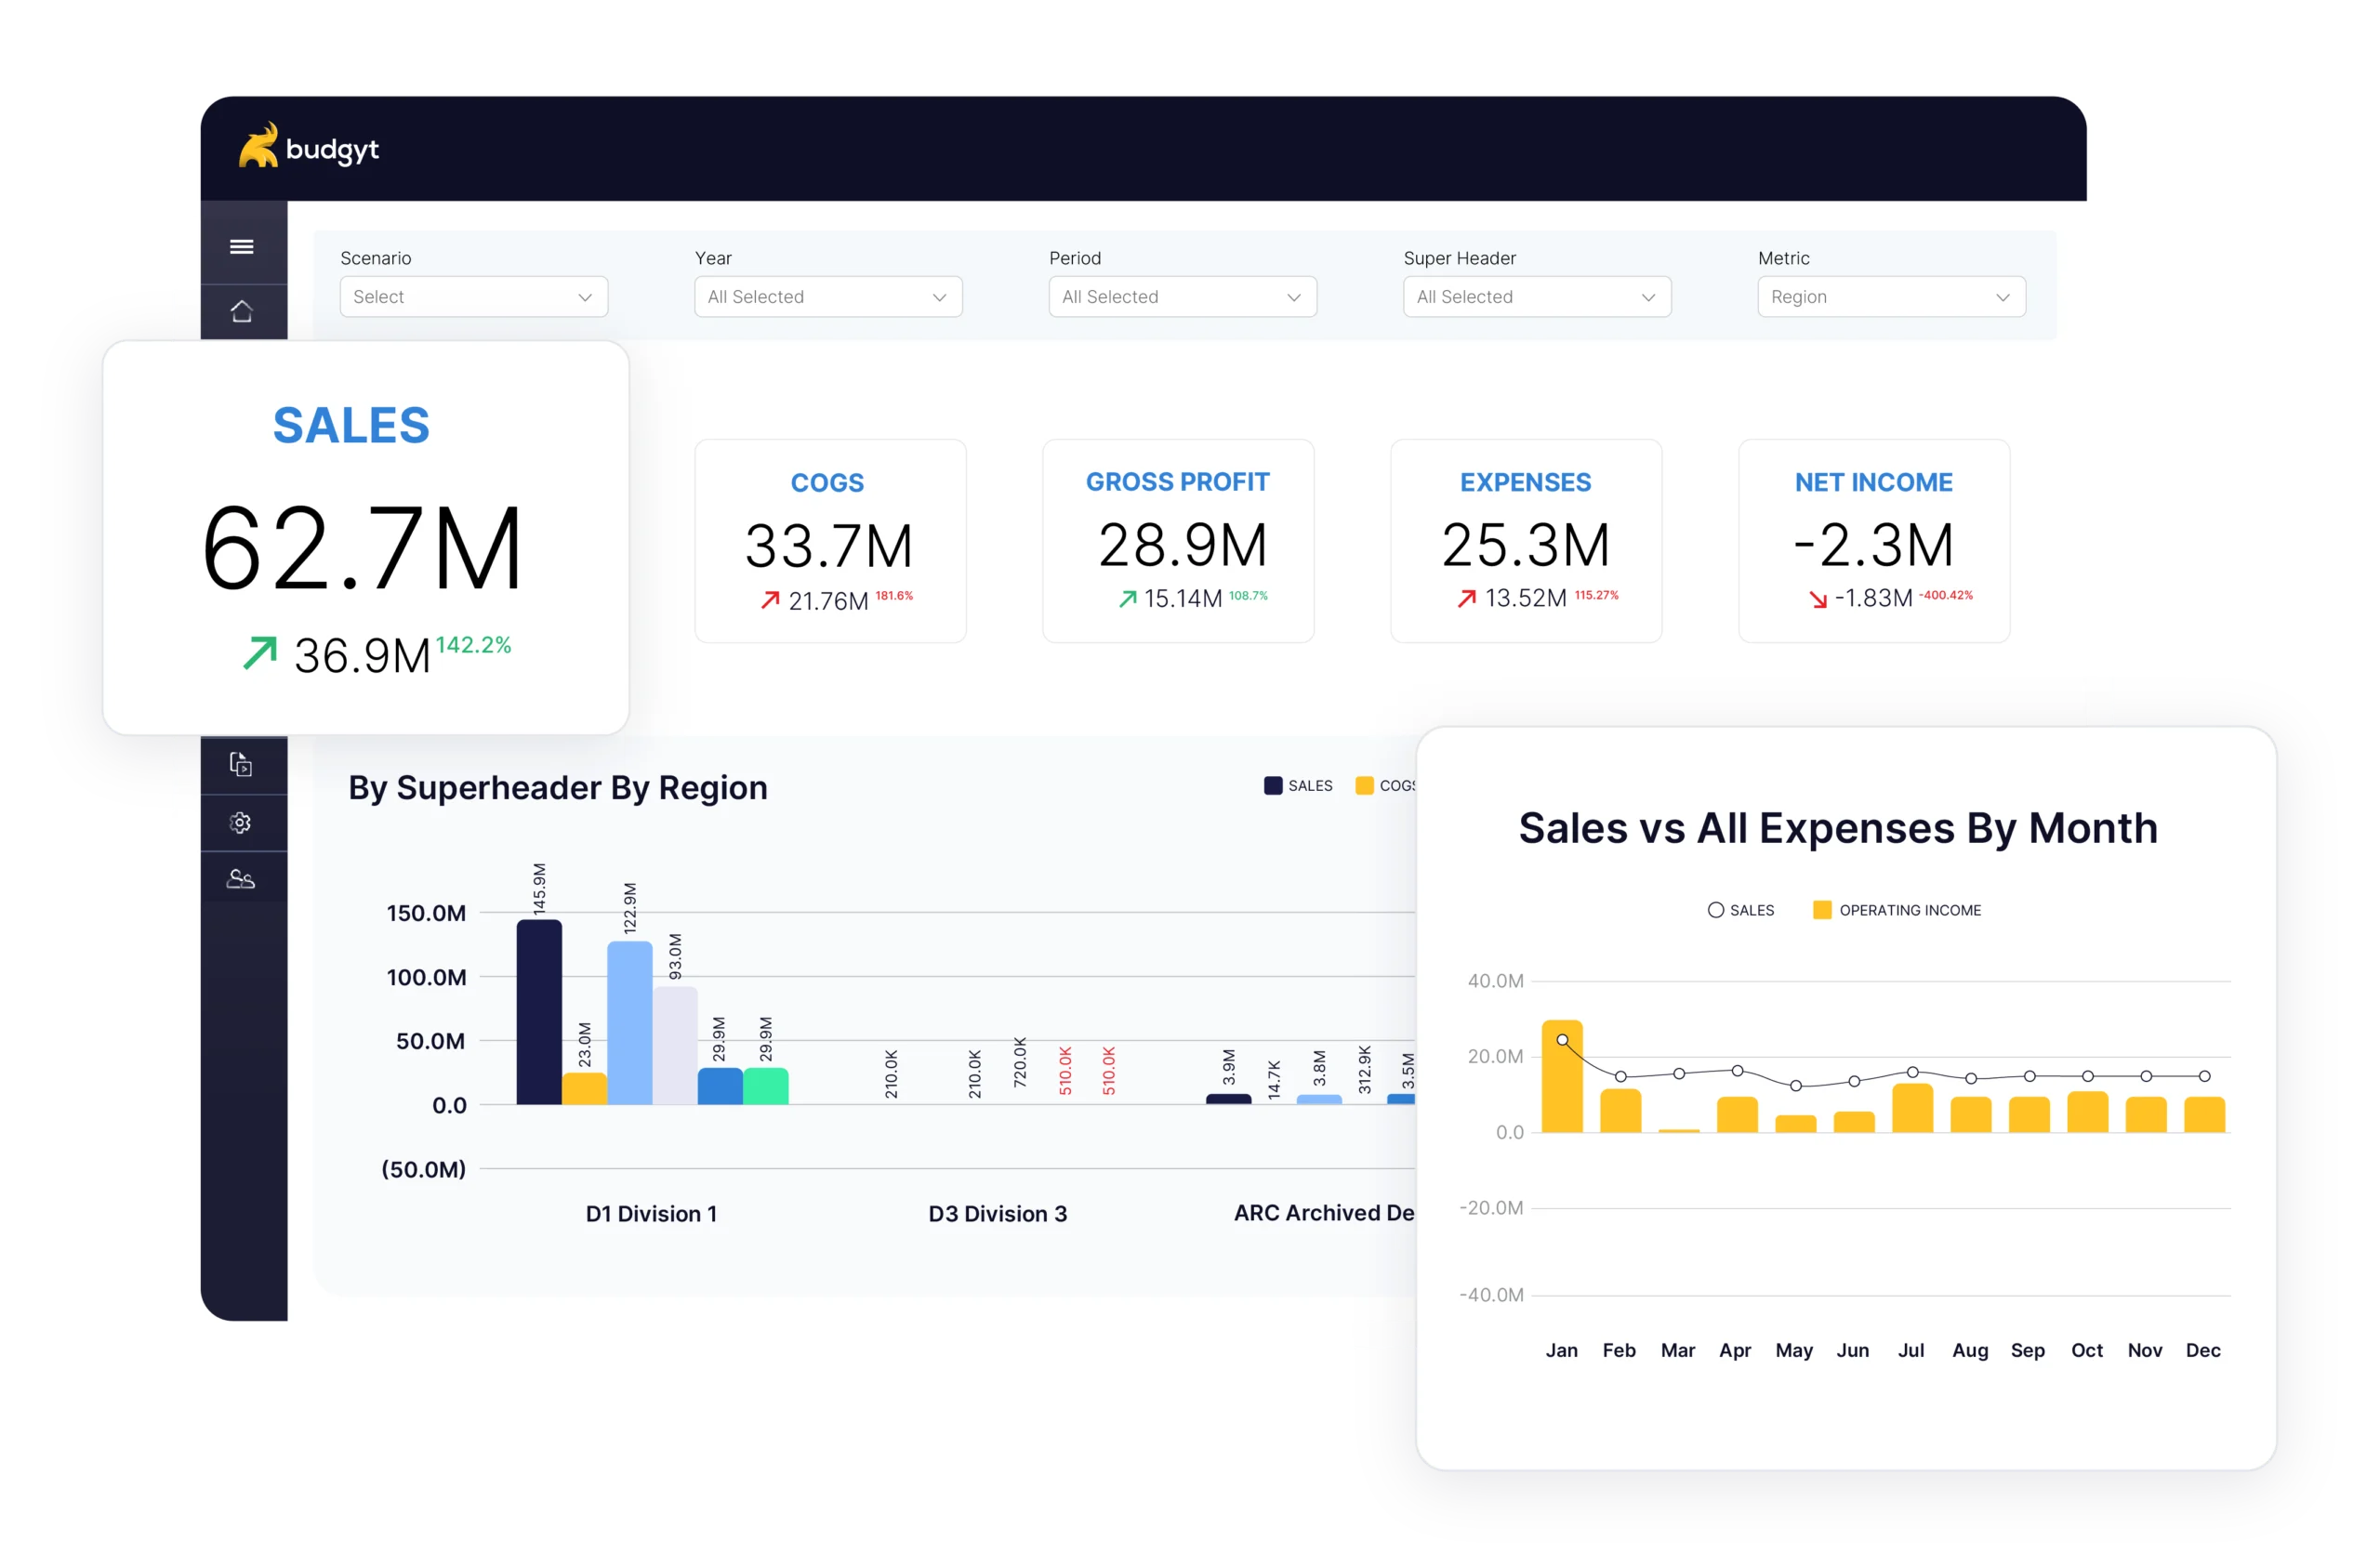
A budget written in November is based on what you knew then. By March, a deal expected to close in Q1 has slipped to Q3, and the finance team is making decisions against a plan that no longer reflects reality. A forecast updates as the year runs, using actual results as they come in. Forecasting software makes that possible for a team that does not have time to rebuild a spreadsheet every month.
The sections below cover the main forecasting methods, when each one applies, and how a budgeting platform handles the parts that are difficult to maintain in a spreadsheet.
A forecast needs to be updated as actual results come in, so you are not comparing against figures that are months out of date. It needs budget owners to enter and maintain their own numbers, so finance doesn’t have to chase down inputs from department heads. It needs to allow finance to compare multiple versions of the plan simultaneously, because most decisions involve choosing among scenarios. If a forecast does not do these things, it will drift toward becoming a static document, much like an annual budget.
Most organizations build one budget per year, approve it, and measure against it for twelve months. By the second quarter, variances between budget and actuals often reflect how much the plan has aged rather than how the business is performing. The budget was accurate when it was written. Updating the forecast on a regular cadence, using actual results as each period closes, keeps it accurate through the year.
A rolling forecast maintains a fixed forward horizon. When a month closes, you add that month’s actuals to the model and extend the forecast by one more month at the far end. If you run a twelve-month rolling forecast, you always have twelve months of forward visibility, regardless of where you are in the calendar year. A typical structure uses three months of actuals and nine months of forecast, with the forecast revised each time a new month of actuals comes in. How to set one up is covered in the rolling forecast post.
Most budgets use more than one method. Different lines have varying levels of predictability, and the method should match them. The table below sets out the main options.
| Method | Best for | Watch for |
| Rolling forecast | Maintaining a fixed forward view of the next several months | Requires updating every time a period closes |
| Scenario planning | Years where more than one outcome is plausible | Can produce too many versions to manage if not kept to a small number |
| Driver-based | Lines that have a reliable relationship to a measurable variable | The driver must actually predict the line, not just correlate with it loosely |
| Run-rate | Lines that are stable and change little from month to month | Breaks down if the conditions that made the line stable have changed |
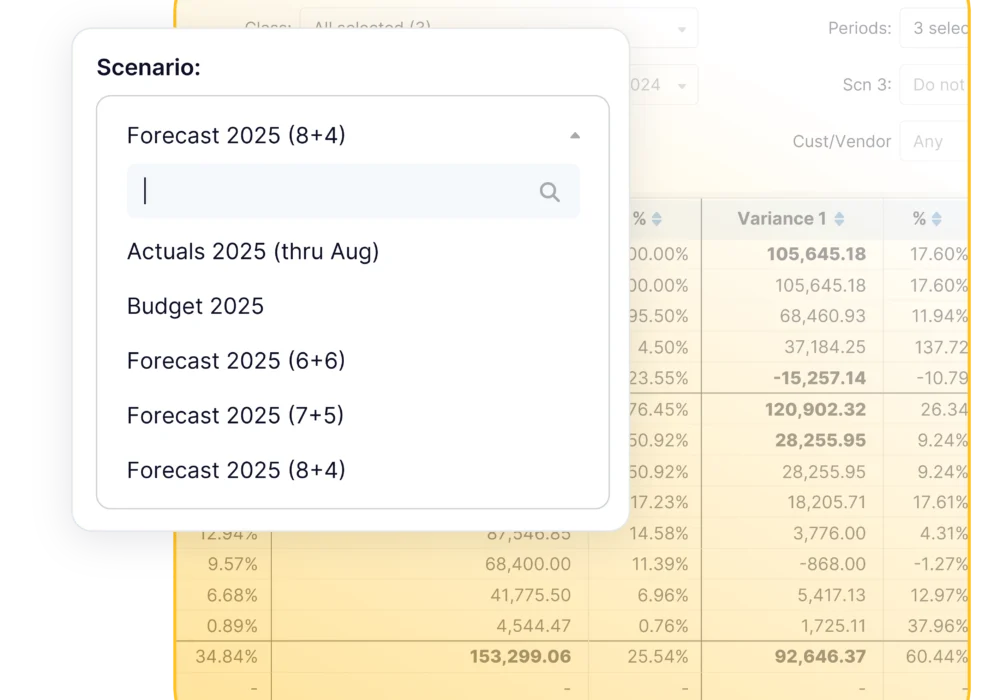
If the year has more than one plausible outcome, a single forecast does not give you enough information to make decisions. Scenario planning means building separate versions of the forecast for different outcomes and comparing them before committing to a plan. Most teams build a downside case based on the risks they are most concerned about, a base case based on their current read of the year, and an upside case based on the best outcome they think is realistic. On a budgeting platform, you change one assumption in one place, and it recalculates across all affected lines. In a spreadsheet, the same change means updating formulas across multiple tabs by hand.
Some budget lines have a direct relationship to a measurable variable. Payroll costs are driven by headcount. The number of active users drives hosting costs. If you set up those relationships in your model, the forecast for those lines updates when the driver changes, rather than being entered each month. The accuracy of a driver-based forecast depends on whether the driver you have chosen actually predicts the line. If payroll costs track headcount reliably, headcount is a good driver. If a line does not move predictably with any single variable, a driver-based approach will not work for that line.
Each line in a budget belongs to someone. The person responsible for a cost center or revenue line has the most accurate information about what is likely to happen to that center or line. Getting that information into the forecast is where the process usually breaks down. If the method is to send spreadsheets by email, collect replies, and consolidate them manually, you will end up with multiple versions of the same data and no clear record of which is current. A budgeting platform lets each owner enter their numbers directly into the same system, with access restricted to the lines they are responsible for. Finance reviews one current version rather than spending time consolidating files.
The forecast sets out what you expect to happen. Variance analysis compares that expectation to what actually happened. The gap between the two tells you where the forecast was wrong, and that information should feed back into the next forecast. Teams that run both processes in the same system can do this without moving data between tools.
Updating the forecast once a year means measuring performance against a plan that may have been accurate in January but is not accurate now. The forecast needs to be updated every time a period closes, using actual results for that period.
Building a single forecast when there are multiple plausible outcomes means you cannot see the full range of possibilities. If revenue could come in anywhere between $2m and $3m, depending on factors outside your control, a single forecast of $2.5m does not tell you much. Building scenarios with different assumptions attached gives you more to work with.
Collecting assumptions by email creates version control problems. When every department head has a copy of the spreadsheet and is updating it independently, there is no single source of truth. A shared system where each owner has access to their own section solves this.
If the current budget is already out of date, the rolling forecast post covers how to set one up.
Budgyt updates the forecast each month as actuals come in. When a period closes, you import actuals from your accounting system, and the forecast recalculates for the remaining periods. You do not need to copy and paste values between spreadsheets or manually update formulas. Scenario versions are stored in the same system, allowing you to compare them directly. Lines can be tied to drivers so that when headcount changes, the payroll forecast for the remaining months updates to match.
Actuals are captured via direct integrations with QuickBooks, NetSuite, Sage Intacct, and Microsoft Dynamics 365 Business Central. You control when they are imported. Implementation takes about two weeks. The full details are on the Budgyt homepage.
You manage millions of dollars. You make decisions affecting dozens of employees. You report to boards with fiduciary responsibility.