Your board is asking about Q4 projections. You’re staring at the annual budget you built nine months ago – back when inflation was different, your headcount plan was different, and that major client renewal was still a sure thing.
The budget says everything’s on track. Reality says otherwise.
This is the moment most finance professionals know too well: when your carefully crafted annual budget becomes a historical artifact rather than a planning tool. The spreadsheet that consumed your December now sits gathering digital dust because it stopped reflecting reality somewhere around March.
There’s a better way. Rolling forecasts transform budgeting from an annual ordeal into a continuous planning process that actually reflects your business as it is, not as you hoped it would be at the start of the year.
Traditional annual budgets create a specific type of organizational blindness. You spend weeks building assumptions in Q4, present them to the board in January, and then what? You’re locked into projections made with information that gets older and less relevant every single month.
When patient volumes fluctuate at your healthcare organization, when grant funding changes mid-year at your nonprofit, when your professional services firm wins or loses major clients – your annual budget just sits there, unchanging, increasingly disconnected from the decisions you need to make today.
The real damage isn’t just that your projections are wrong. It’s that you lose the ability to plan adaptively. Rolling forecasts solve this by creating a perpetual planning horizon. Instead of budgeting once a year, you’re constantly looking ahead, updating projections based on what’s actually happening in your business.
The core concept is straightforward: maintain a continuous 12-month forward view that updates regularly – typically monthly or quarterly.
Here’s what that looks like in practice. It’s May, and instead of comparing actuals against a budget built last December, you’re working with three months of actual results (January through March) plus a fresh nine-month forecast (April through December) that incorporates everything you’ve learned in those first three months.
Next month, you drop January, add April actuals, and extend your forecast one more month into the future. You’re always looking 12 months ahead, but that 12-month window keeps moving forward with your business.
The question isn’t whether rolling forecasts are valuable – it’s whether your current tools can actually support them. If you’re trying to maintain rolling forecasts in Excel, you already know the answer. Those formulas don’t update themselves, and rebuilding forecast scenarios manually every month turns a good idea into an unsustainable burden.
Start by deciding your forecast horizon and update frequency. Most organizations work with a 12-month rolling forecast updated monthly, though some prefer quarterly updates or an 18-month window depending on their planning cycles.
Key decisions for your rolling forecast structure:
The technical challenge is creating a forecast structure that can roll forward cleanly. In Excel, this means maintaining separate tabs for each period, copying and pasting historical data, and rebuilding formulas that inevitably break when you extend date ranges.
This is where purpose-built forecasting software fundamentally changes the equation. With platforms like Budgyt, your forecast structure doesn’t need to be rebuilt monthly – it automatically rolls forward, shifting actual data into place and extending your projection window without touching a single formula.
At the start of each month, your actuals import automatically, last month’s forecast becomes history, and you extend your planning horizon one more month into the future. What took hours in spreadsheets happens in minutes.
Not every line item needs the same forecasting approach. Revenue, your largest expenses, and key business drivers deserve detailed attention.
Priority areas for detailed forecasting:
For most organizations, payroll is both your largest expense and the one requiring the most detailed forecasting. Employee salaries need to be allocated across departments, potentially across grants or projects, with proper treatment of benefits, taxes, and any mid-year hiring or departures.
If you’re building this in Excel, you know what this means: endless VLOOKUP formulas trying to match employees to departments, allocation percentages that need manual updating, and Social Security limits that someone has to remember to apply. One employee moves departments, and you’re fixing formulas across multiple sheets.
Professional forecasting software handles this through built-in payroll allocation. You set up your employee structure once – salaries, departments, allocation rules – and the system manages the complexity. When funding changes at your nonprofit or your clinic hires additional nursing staff, those allocations update instantly across your forecast.
The most powerful rolling forecasts connect financial projections to business drivers. Instead of forecasting revenue as a single top-line number, you’re projecting the underlying metrics that drive revenue – customer counts, average transaction sizes, utilisation rates – and letting the revenue calculation flow from there.
Common business drivers by industry:
For healthcare organizations, this might mean forecasting patient volumes by service line and then calculating the staffing and supply costs those volumes require. For nonprofits, it’s projecting programme participation and then determining the staff time allocation across grants needed to support those programmes.
The challenge with driver-based forecasting in spreadsheets is maintaining the links between drivers and results. Your patient volume assumptions live in one tab, your staffing calculations in another, your supply costs somewhere else. Change a driver assumption and you’re clicking through tabs hoping all the right cells are updated.
This is where database-driven platforms show their advantage. Your business drivers connect directly to your financial projections. Update patient volumes in one place, and the staffing costs, supply budgets, and revenue projections all reflect that change instantly.
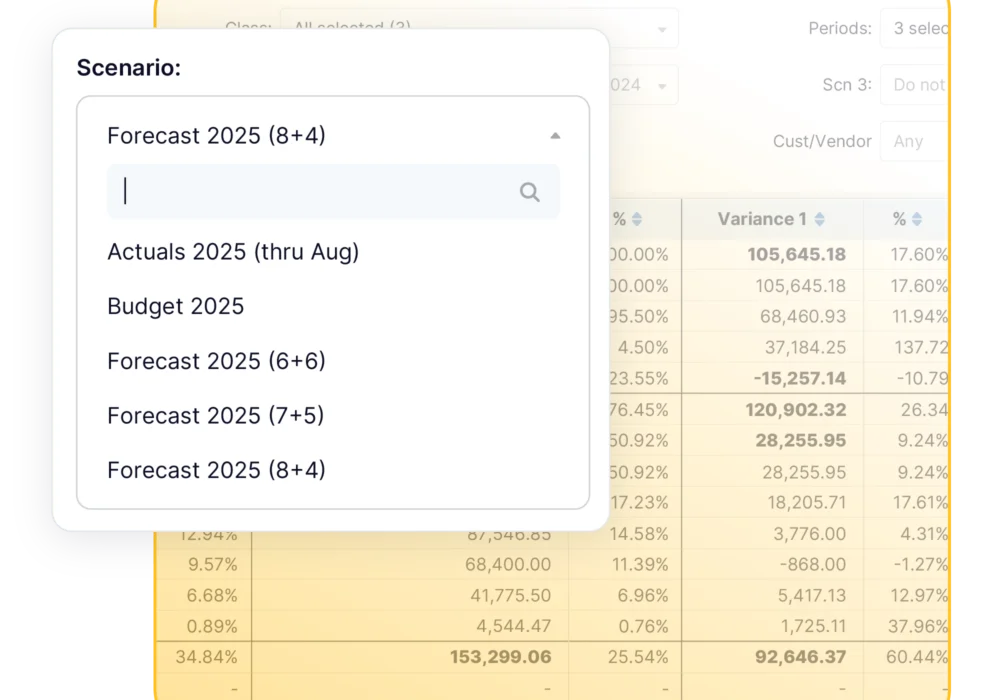
One major advantage of rolling forecasts is the ability to model different scenarios without losing your baseline projection.
Your professional services firm is considering opening a new office location. Your nonprofit is pursuing a major grant that could double a programme. Your healthcare system is evaluating whether to add a new service line. These decisions need financial modelling, but you can’t lose track of your baseline forecast while you’re exploring scenarios.
In Excel, this typically means saving multiple versions of your entire file and losing track of which assumptions live in which version. Comparing scenarios side by side requires opening multiple files and trying to remember which cells to look at.
Proper forecasting software treats scenarios as first-class objects. You maintain your baseline forecast and create alternative scenarios that branch from it. Want to see how adding five employees affects your cash position? Create a scenario. Want to compare aggressive growth versus conservative plans? Build both scenarios and toggle between them instantly.
Scenarios worth modelling:
You can see exactly how hiring decisions affect your runway, how different revenue assumptions impact your ability to fund new initiatives, or how grant funding changes ripple through your entire operating budget.
Rolling forecasts only work if actual results flow in smoothly to replace projections as months close. This is perhaps the biggest practical challenge with spreadsheet-based forecasting: getting actual data from your accounting system into your forecast model without destroying formulas.
Most finance teams end up exporting data from QuickBooks or their ERP system, massaging it in Excel to match their forecast structure, and then carefully pasting it into their forecast file while praying nothing breaks. It works, but it’s time-consuming and error-prone.
Professional forecasting platforms solve this through direct accounting system integration. Your Chart of Accounts, departments, and transaction data flow automatically from systems like QuickBooks Online, NetSuite, Sage Intacct, or Microsoft Dynamics 365 Business Central.
What automatic integration actually means:
This automatic data flow does more than save time – it enables more frequent reforecasting. When importing actuals takes five minutes instead of five hours, you can refresh your forecast as often as your business actually changes.
Budgyt’s deep API connections handle this integration seamlessly several accounting platforms. You’re not building import macros or copying data between systems – the connection just works, month after month.
One of the most valuable aspects of rolling forecasts is the ability to understand not just where you are versus plan, but how your projections themselves are changing over time.
Traditional budget-to-actual variance analysis asks “how did we perform versus the annual budget?” Rolling forecast variance analysis asks richer questions: “How has our full-year projection changed since last month? What assumptions drove that change?”
This type of analysis reveals patterns that static annual budgets hide. If your healthcare organization consistently over-forecasts patient volumes in specialty services, that pattern only becomes visible when you track how forecasts evolve month by month.
The practical challenge is that this level of analysis is nearly impossible in spreadsheets. You’d need to save every monthly forecast version, build comparison reports manually, and track assumption changes across files.
With proper FP&A software, variance analysis becomes a core feature rather than a manual project. Budgyt’s drill-down variance analysis lets you click any variance to see exactly which departments, accounts, or vendors drove the difference – from summary to transaction detail in two clicks.
The conceptual advantages of rolling forecasts are clear enough that most finance professionals understand their value. The implementation is where most organizations struggle.
The honest assessment: if you’re trying to maintain rolling forecasts in Excel, you’re fighting your tools. Spreadsheets were designed for static analysis, not continuous forward-planning processes. Every month, you’re rebuilding formulas, copying data, and hoping nothing breaks.
This is exactly the problem modern FP&A platforms solve. The reforecasting process that takes hours in spreadsheets happens in minutes with the right software. Your forecast structure stays intact, actuals flow in automatically, and you extend your planning horizon without touching formulas.
The result is what rolling forecasts promise: continuous planning that keeps pace with your business, scenario modelling that supports better decisions, and financial projections that stay relevant all year long rather than becoming obsolete by March.
If you’re serious about implementing rolling forecasts, you need tools built for that purpose. The spreadsheet that got you this far probably isn’t going to get you there. See how Budgyt handles the complete budgeting lifecycle – from building bulletproof budgets to analysing variances to reforecasting based on reality.
Ready to see how Budgyt handles rolling forecasts? Book a demo to see Budgyt in action or read more on how finance teams use forecasting software.
You manage millions of dollars. You make decisions affecting dozens of employees. You report to boards with fiduciary responsibility.