Drill down by vendor
See which suppliers are driving expense variances
Drill down to any segment of your account between any two scenarios, and click any variance by transaction, dimension or both.
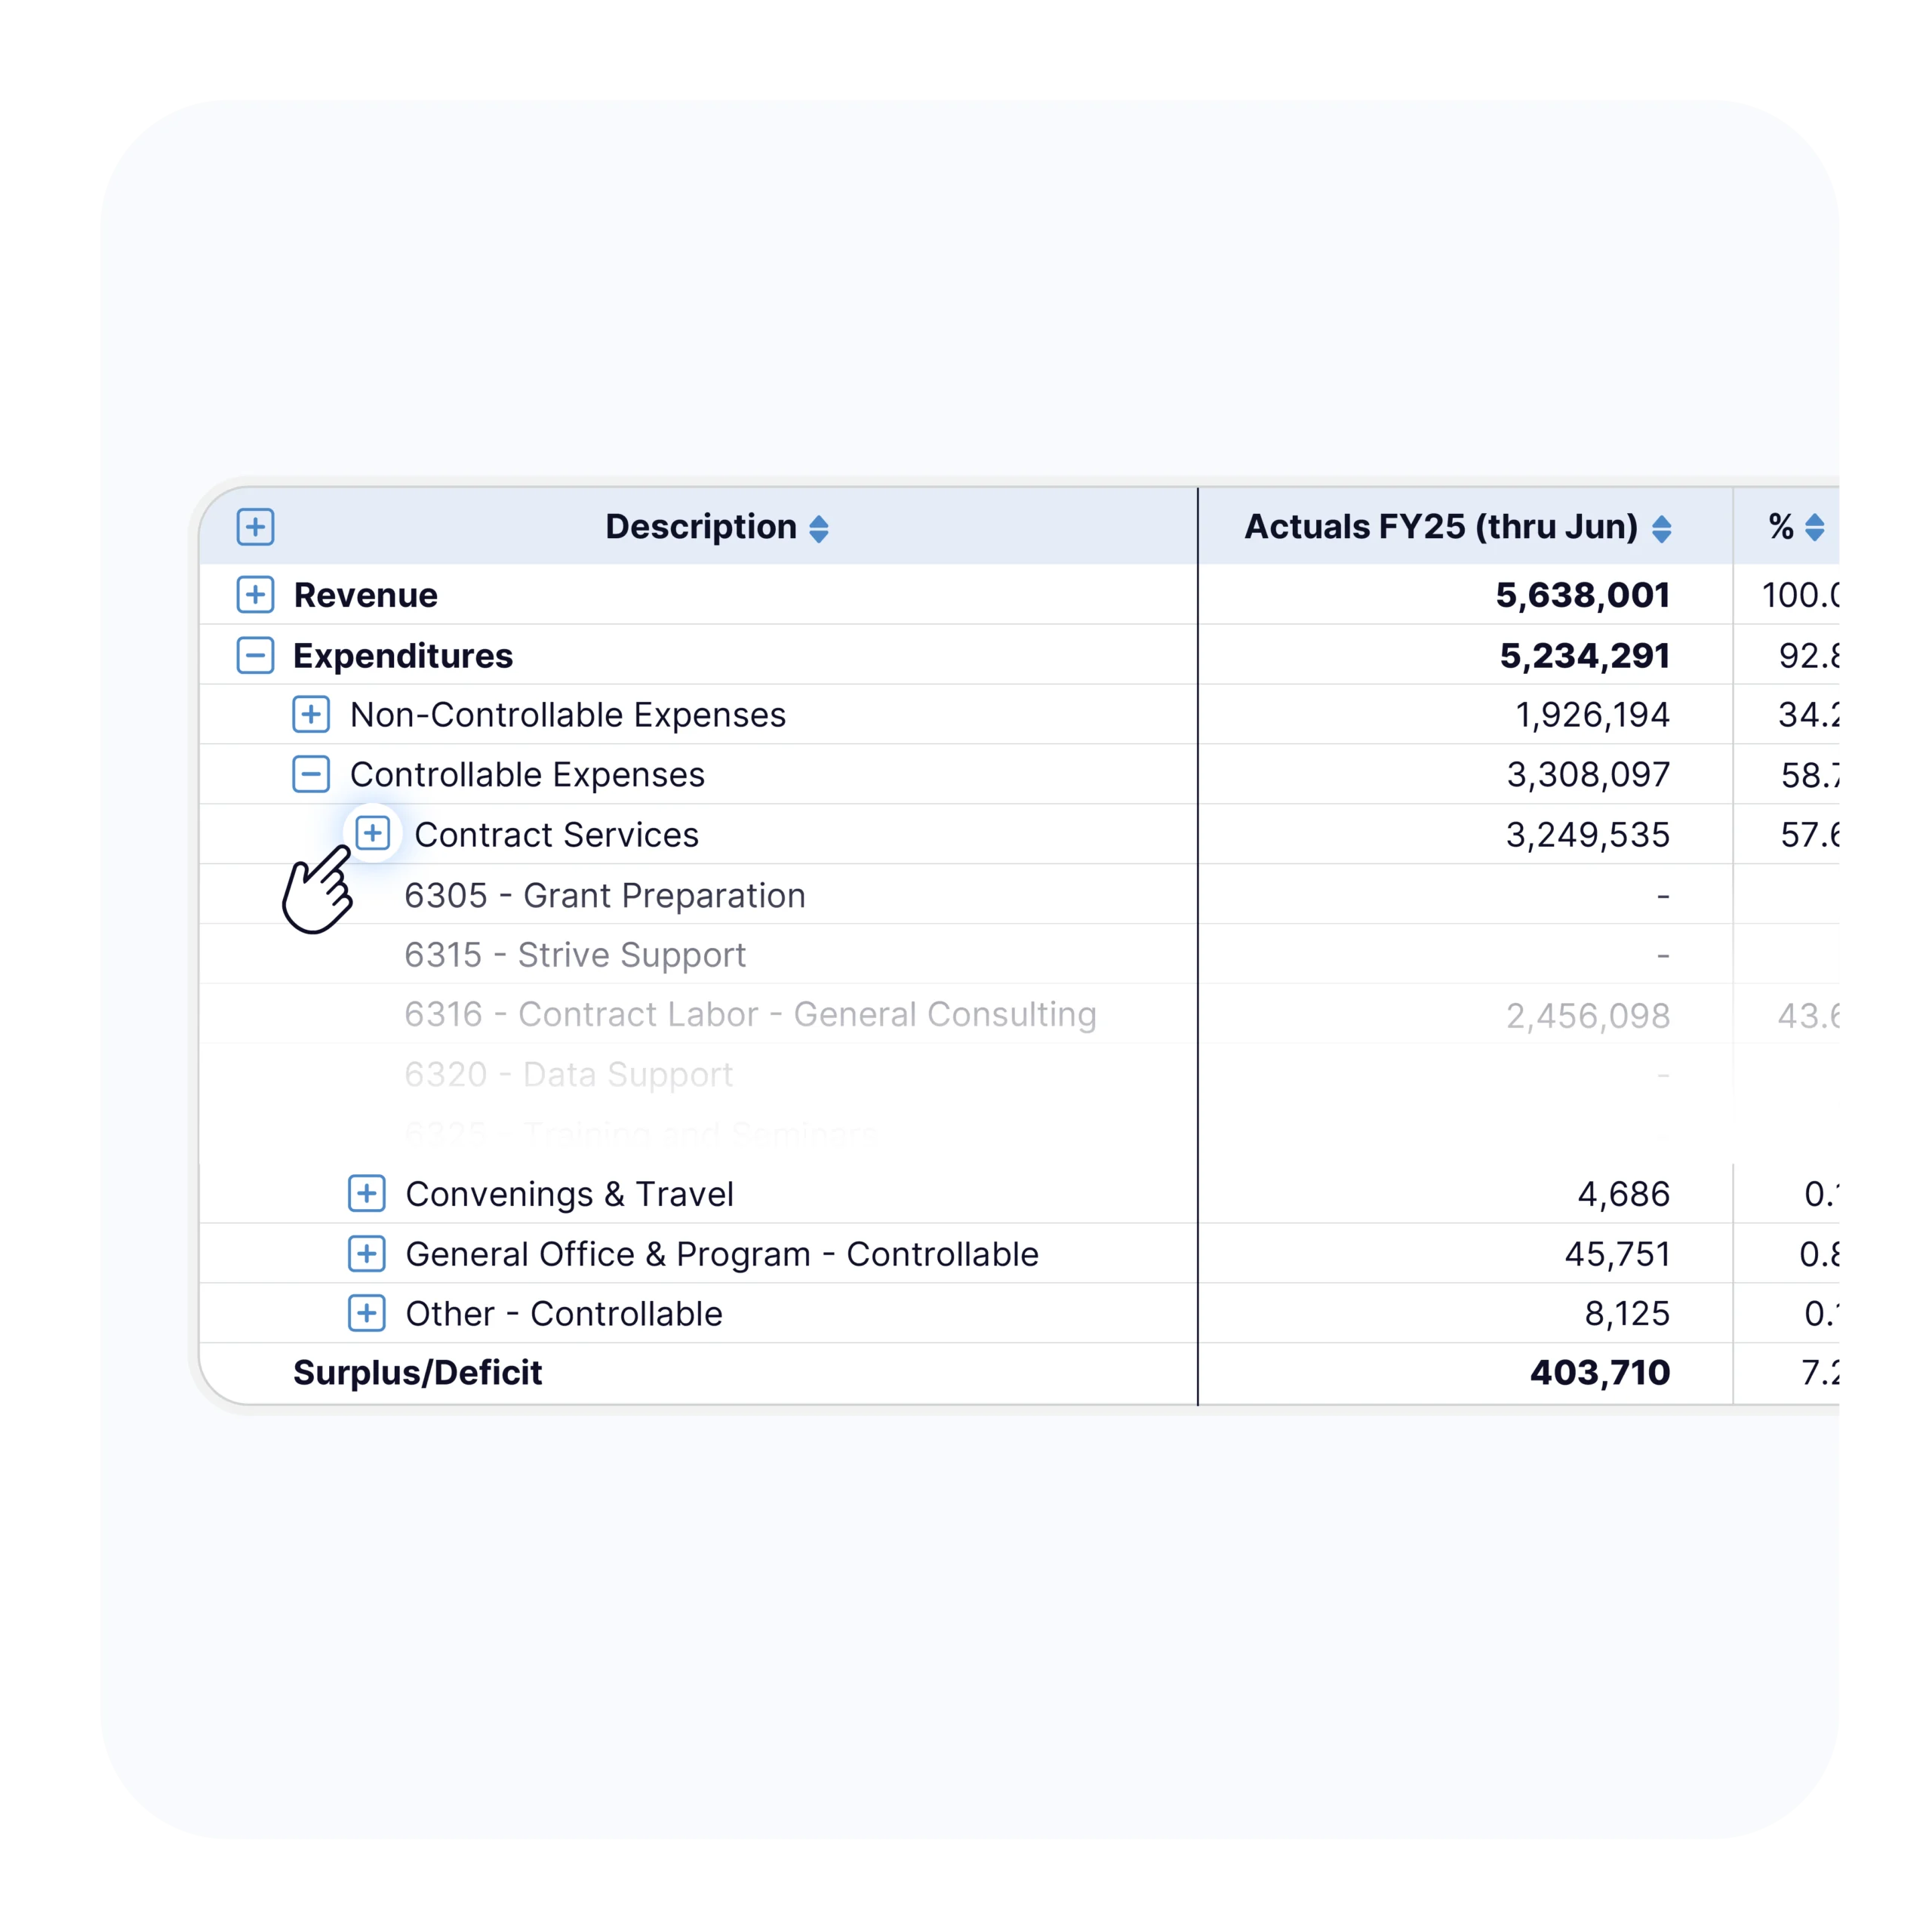
Hierarchical dashboard navigation lets you drill from summary to transaction-level detail instantly. Want to see why Marketing is over budget by vendor or timing by month? Click. Need the specific vendor driving that variance? Click again.
Get your actuals to the transaction level or audit your budget details using hyperlinks to the data sheet. Filter by dimension like vendor or customer if you have budgeted at that degree. No more hunting through hidden worksheets while the board drum their fingers.
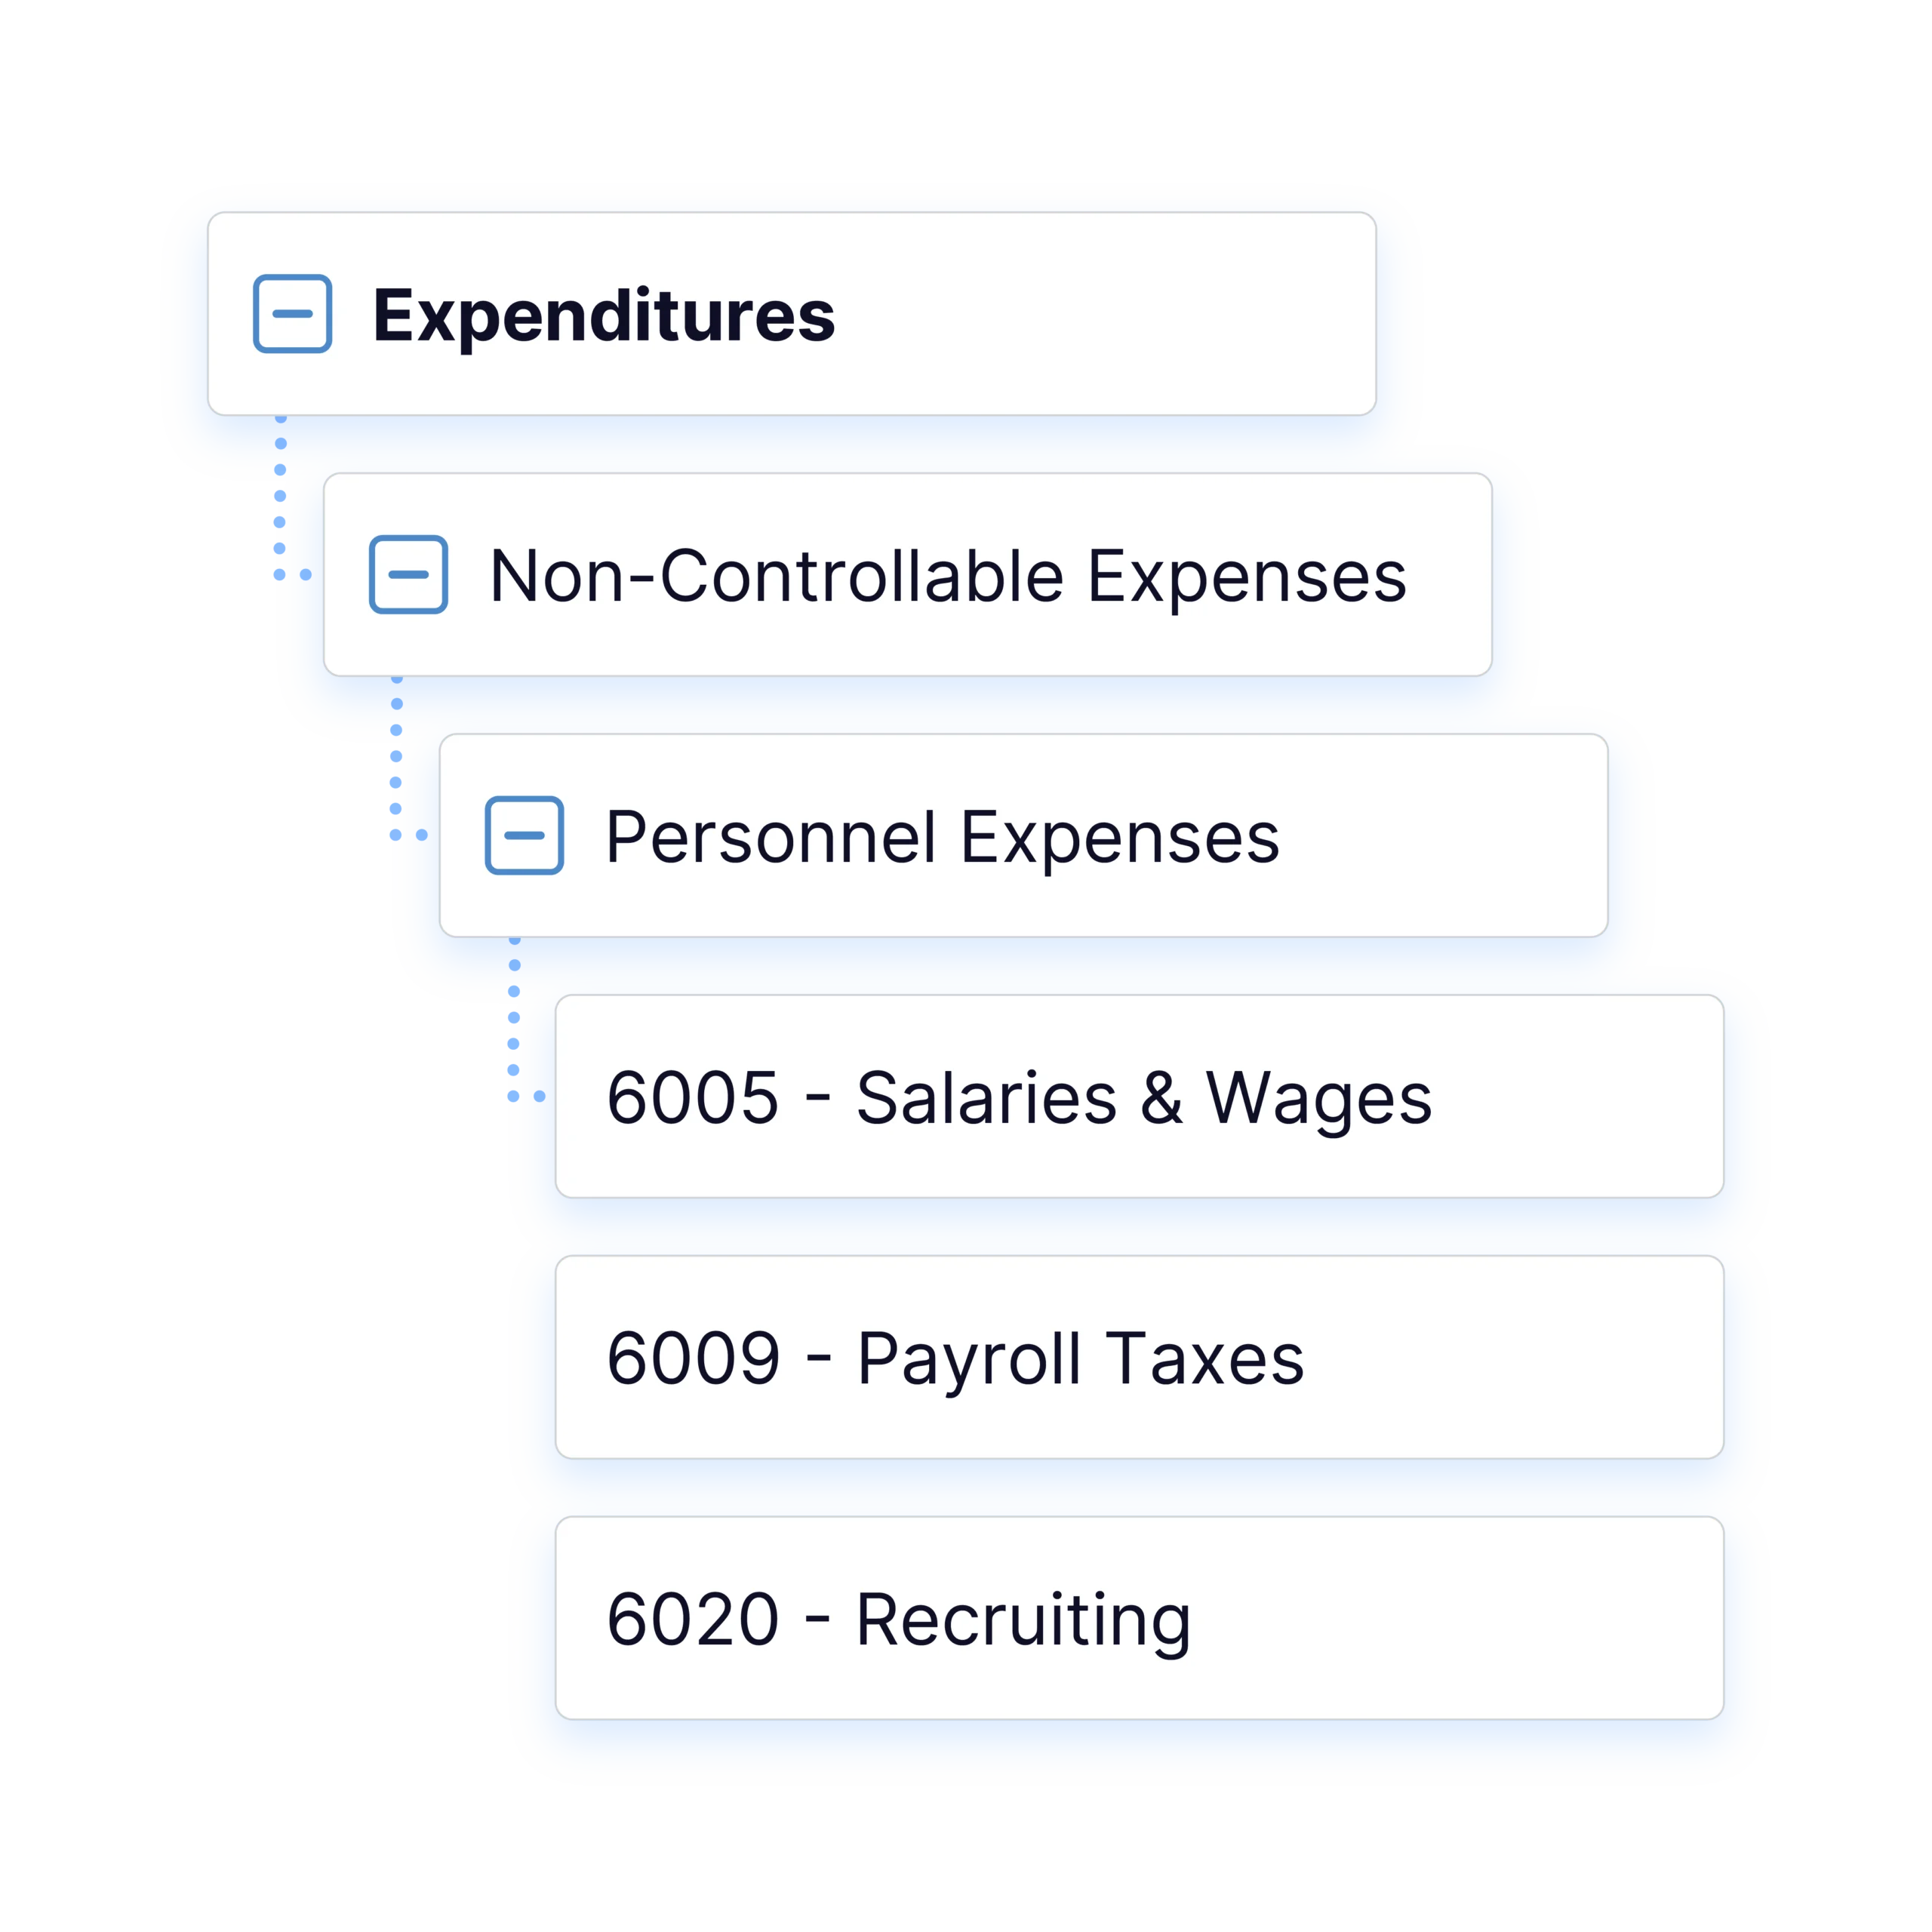
Four hierarchical levels in your chart of accounts, three levels of organizational structure, and two layers for unlimited dimensions. All automatically rolled up with no need for risky formulas. Filter at every level to display your data your way while honoring user permissions.
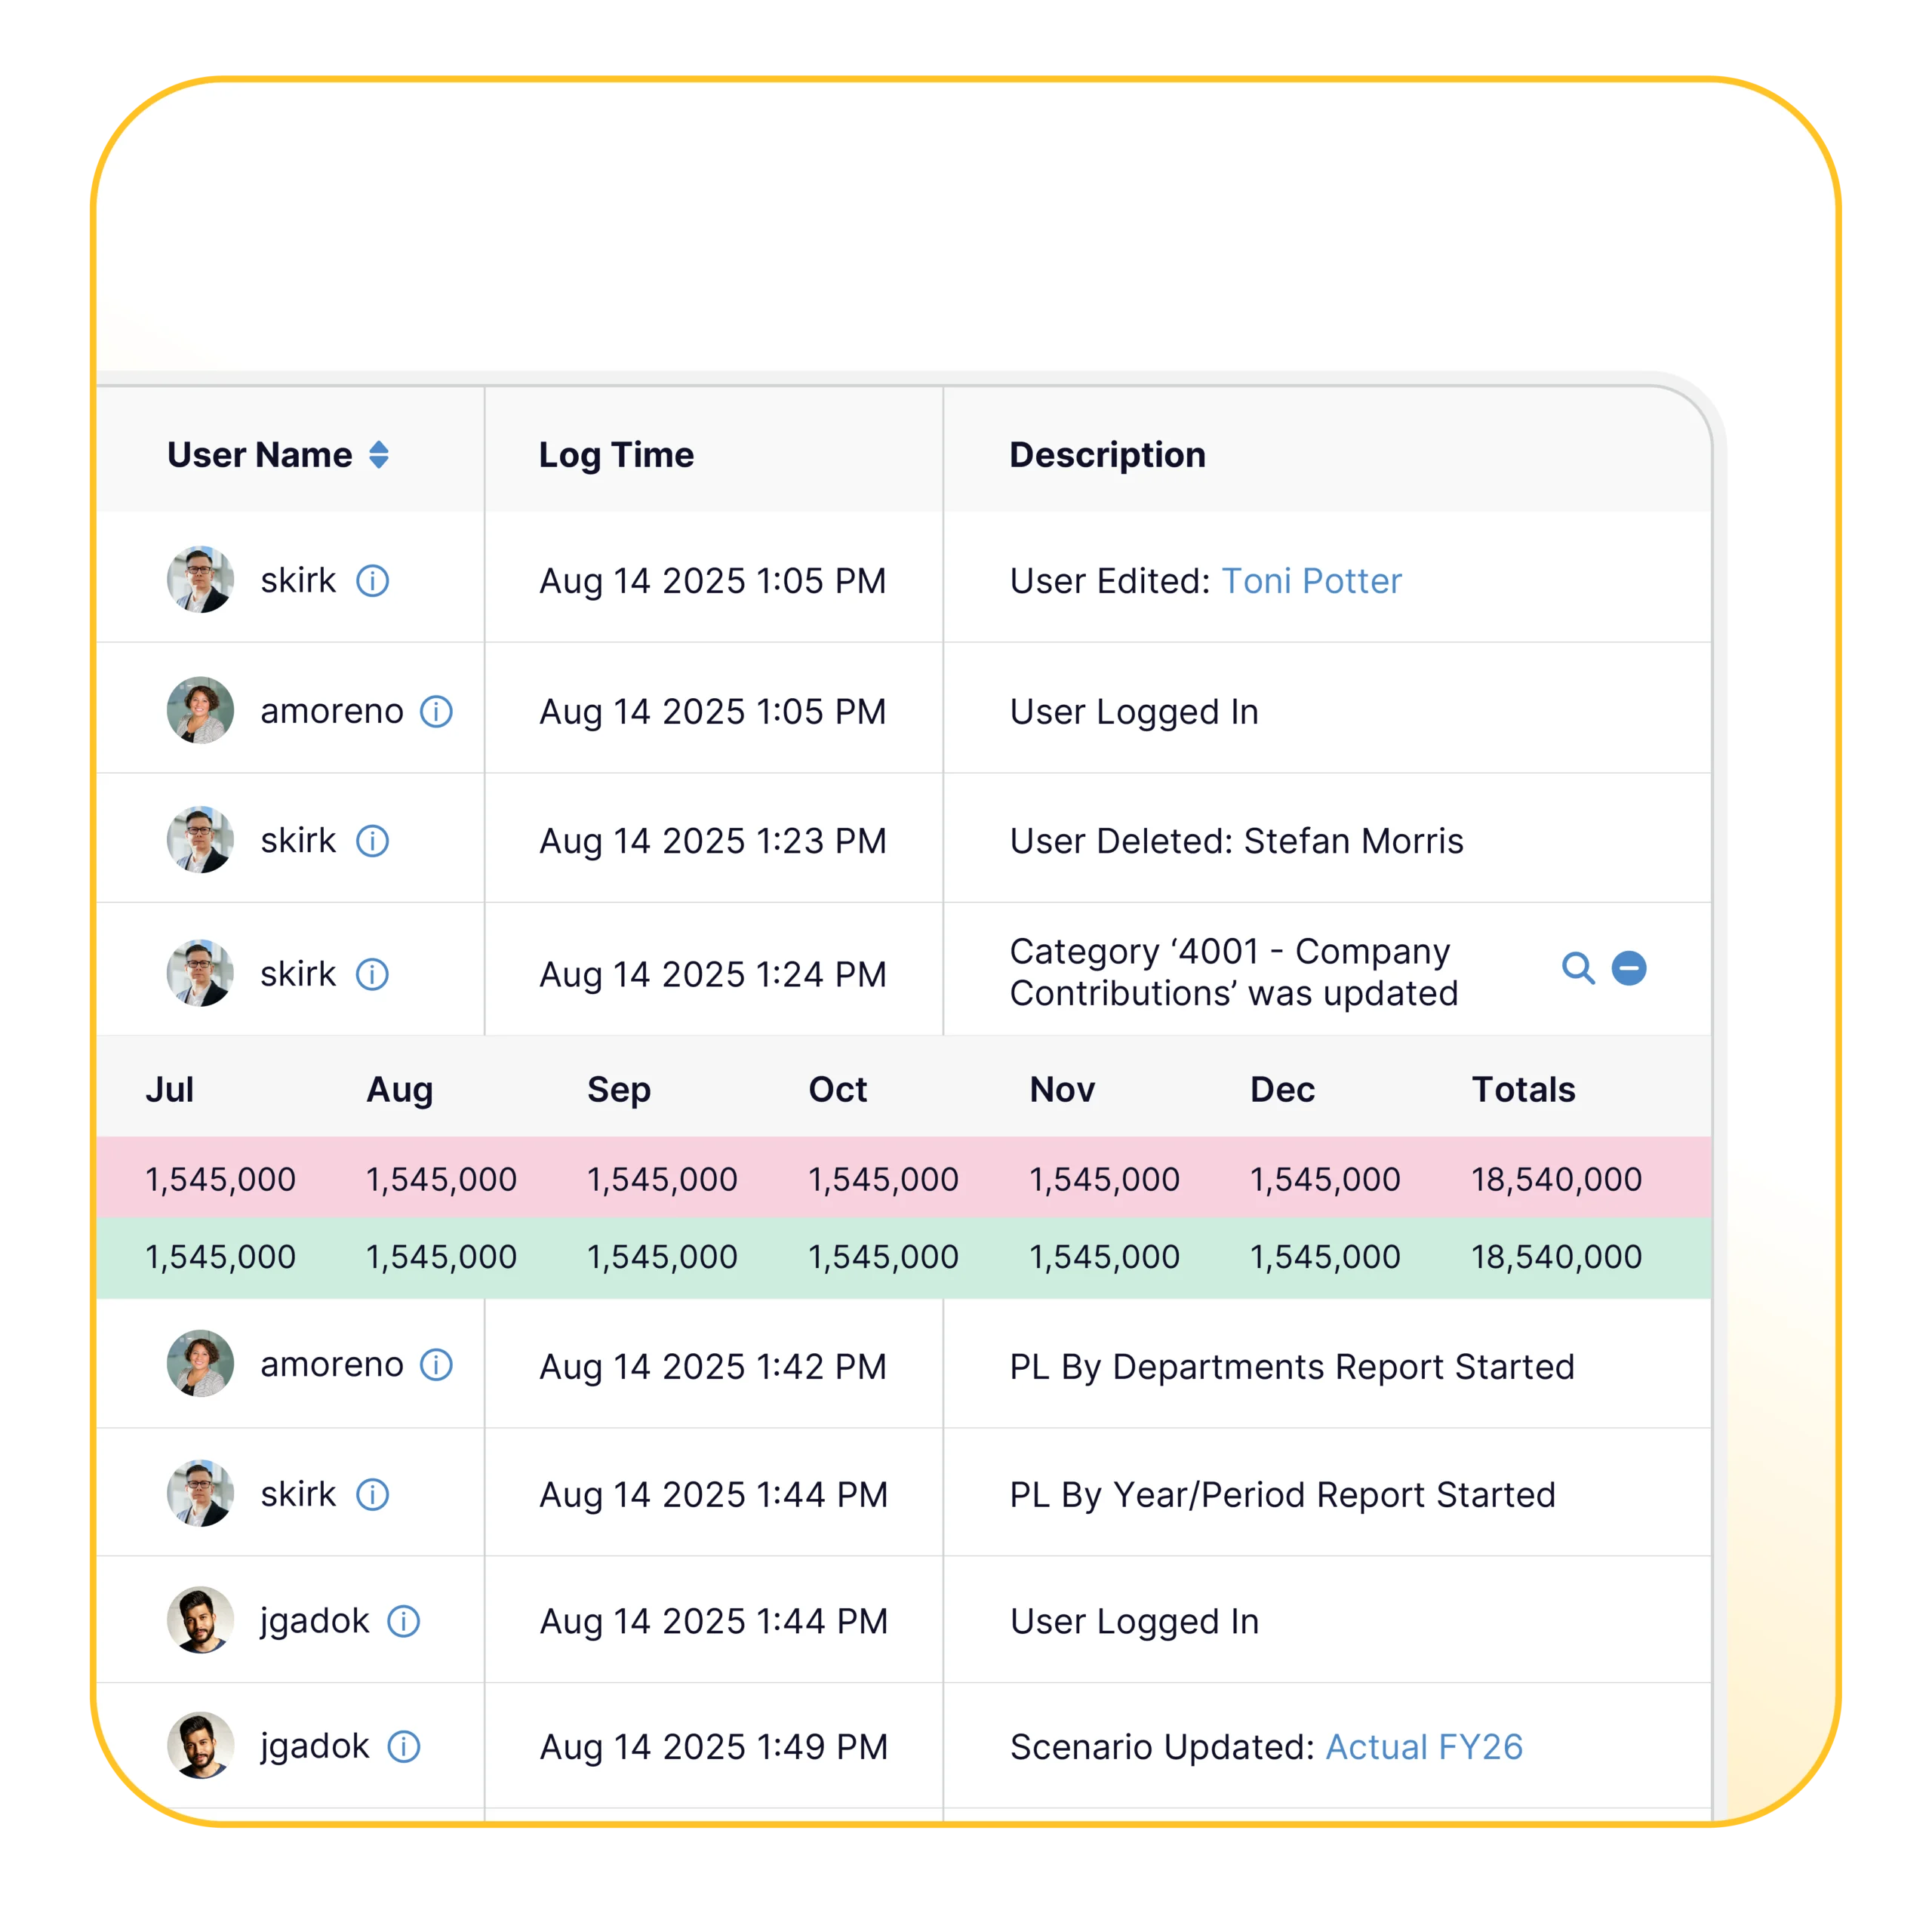
Click any number to see exactly how it was calculated. Double-click for the full story instantly, including all changes by every user. No more “let me get back to you” in board meetings.
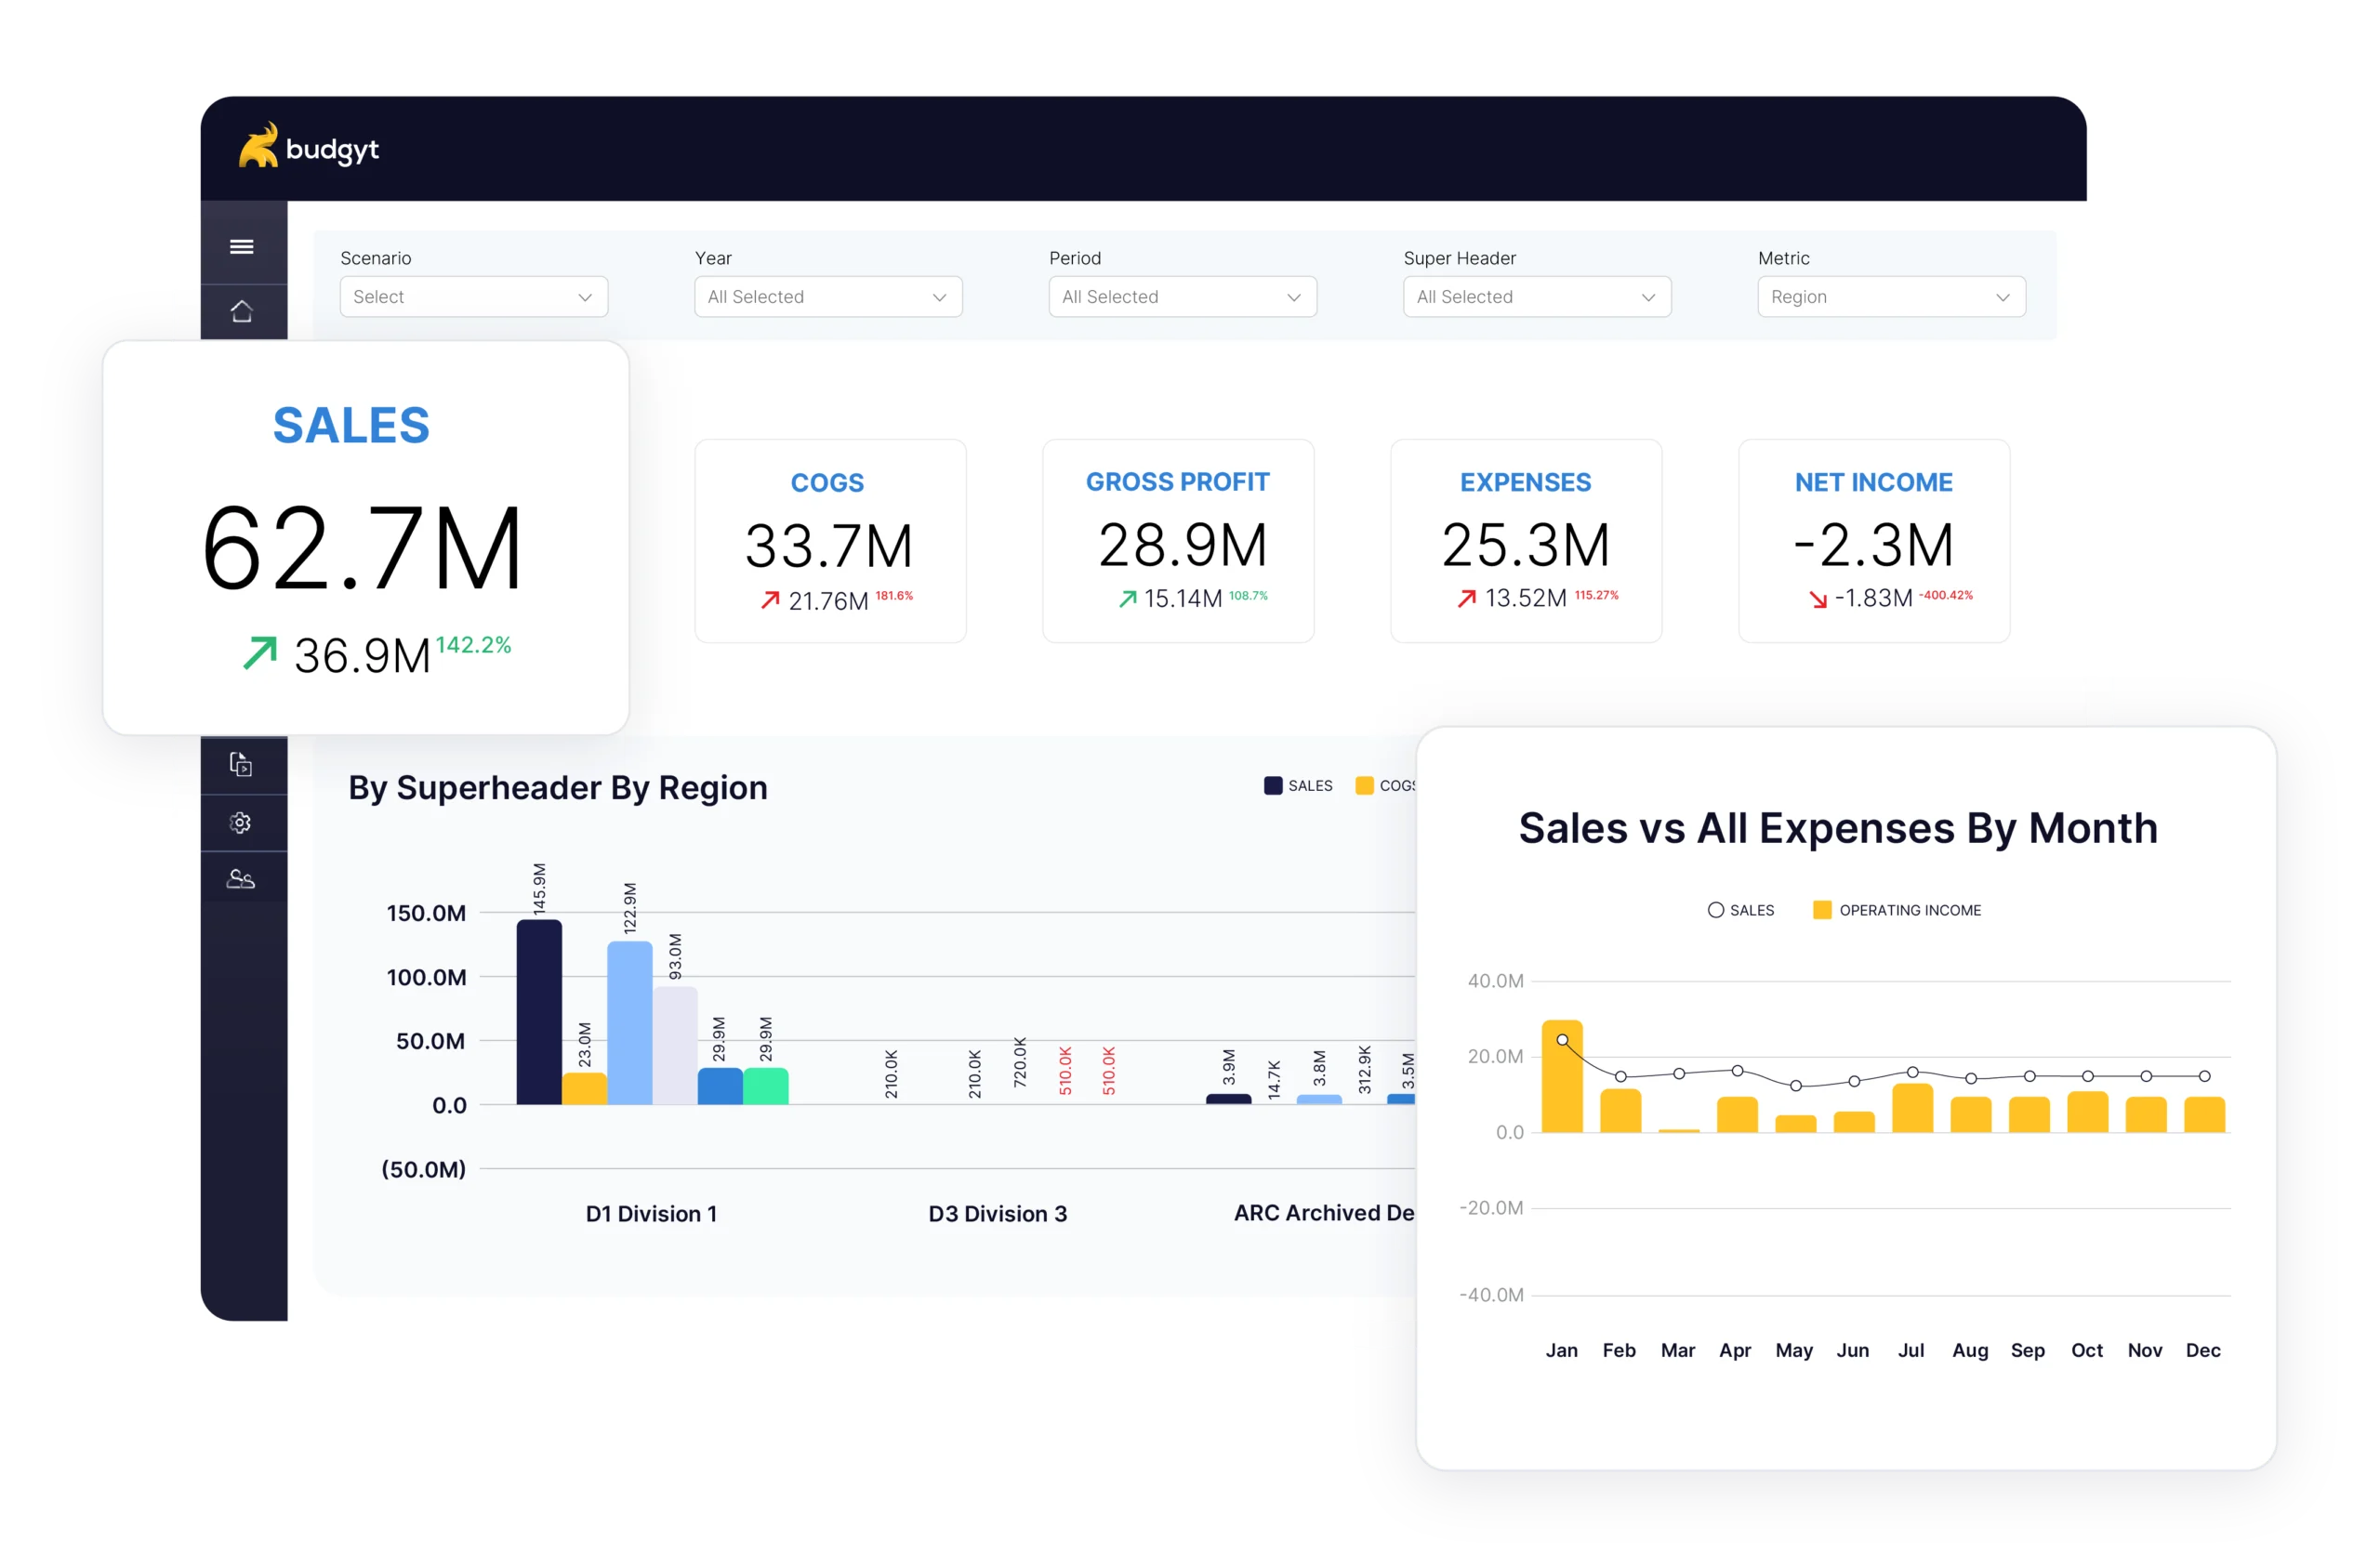
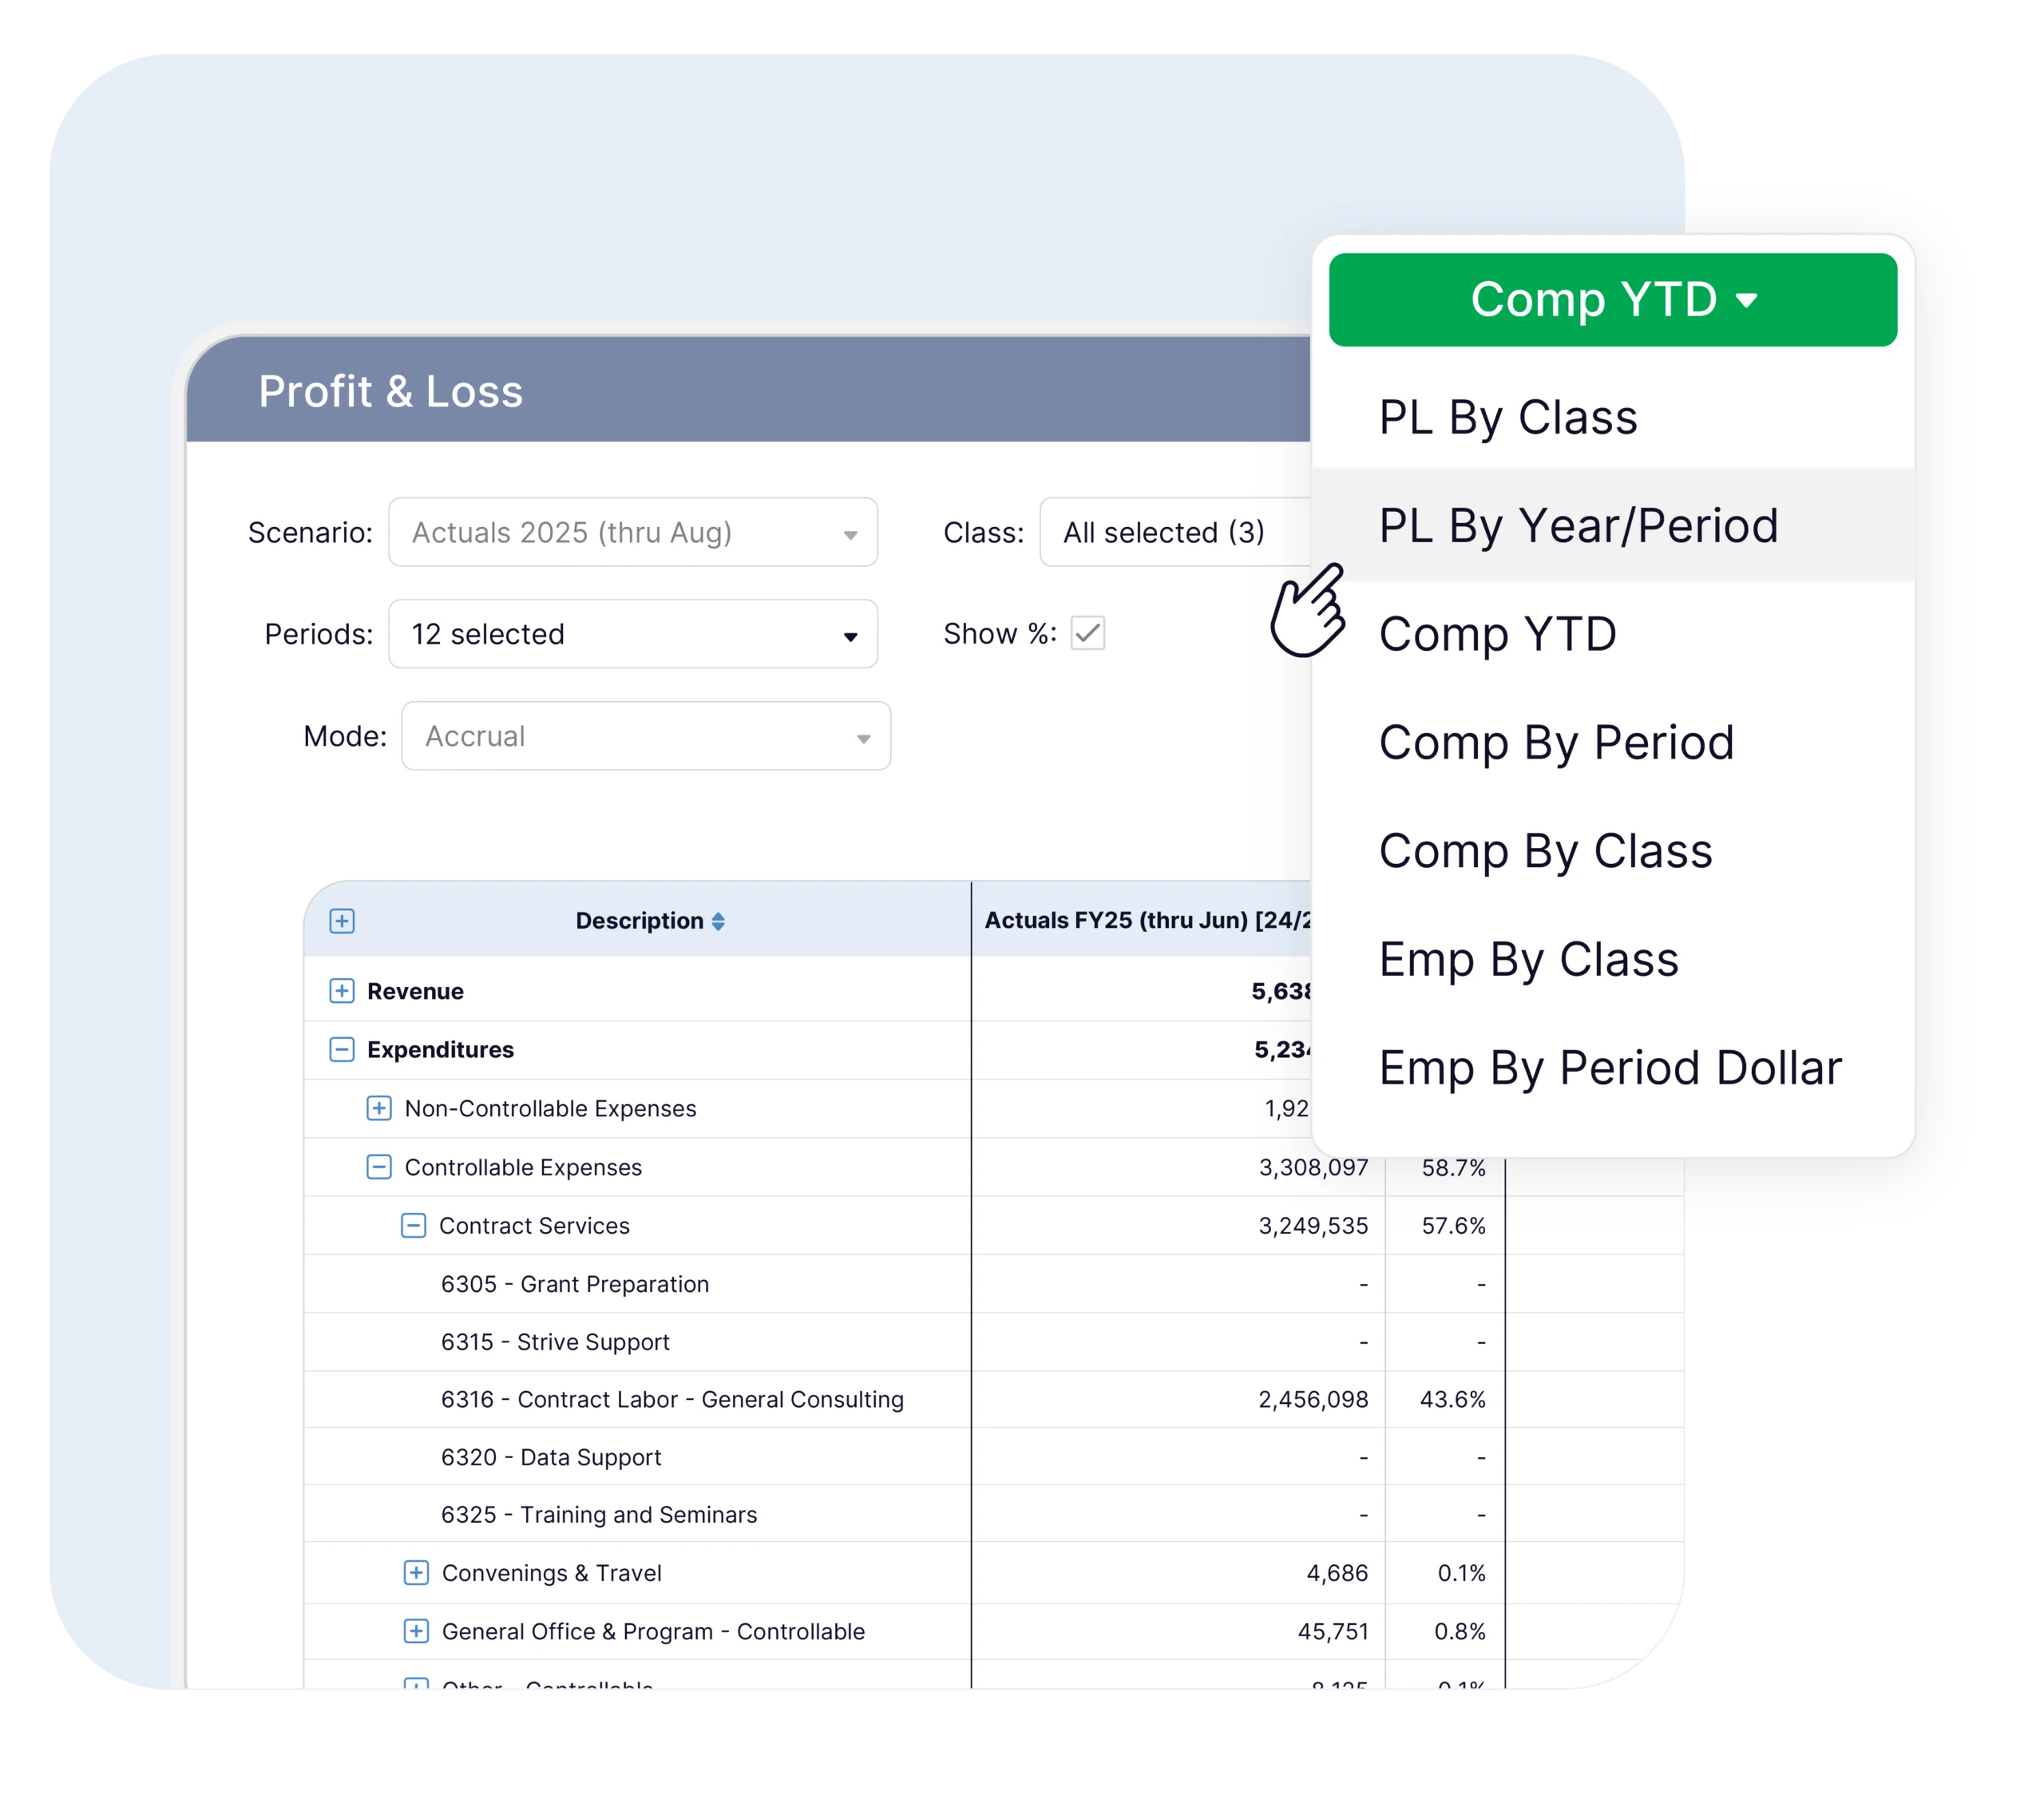
Compare budgets to actuals side by side at any level of detail – instantly. Our database foundation means you can:
See which suppliers are driving expense variances
Understand revenue performance at client level
Track performance across departments, projects, or any custom grouping
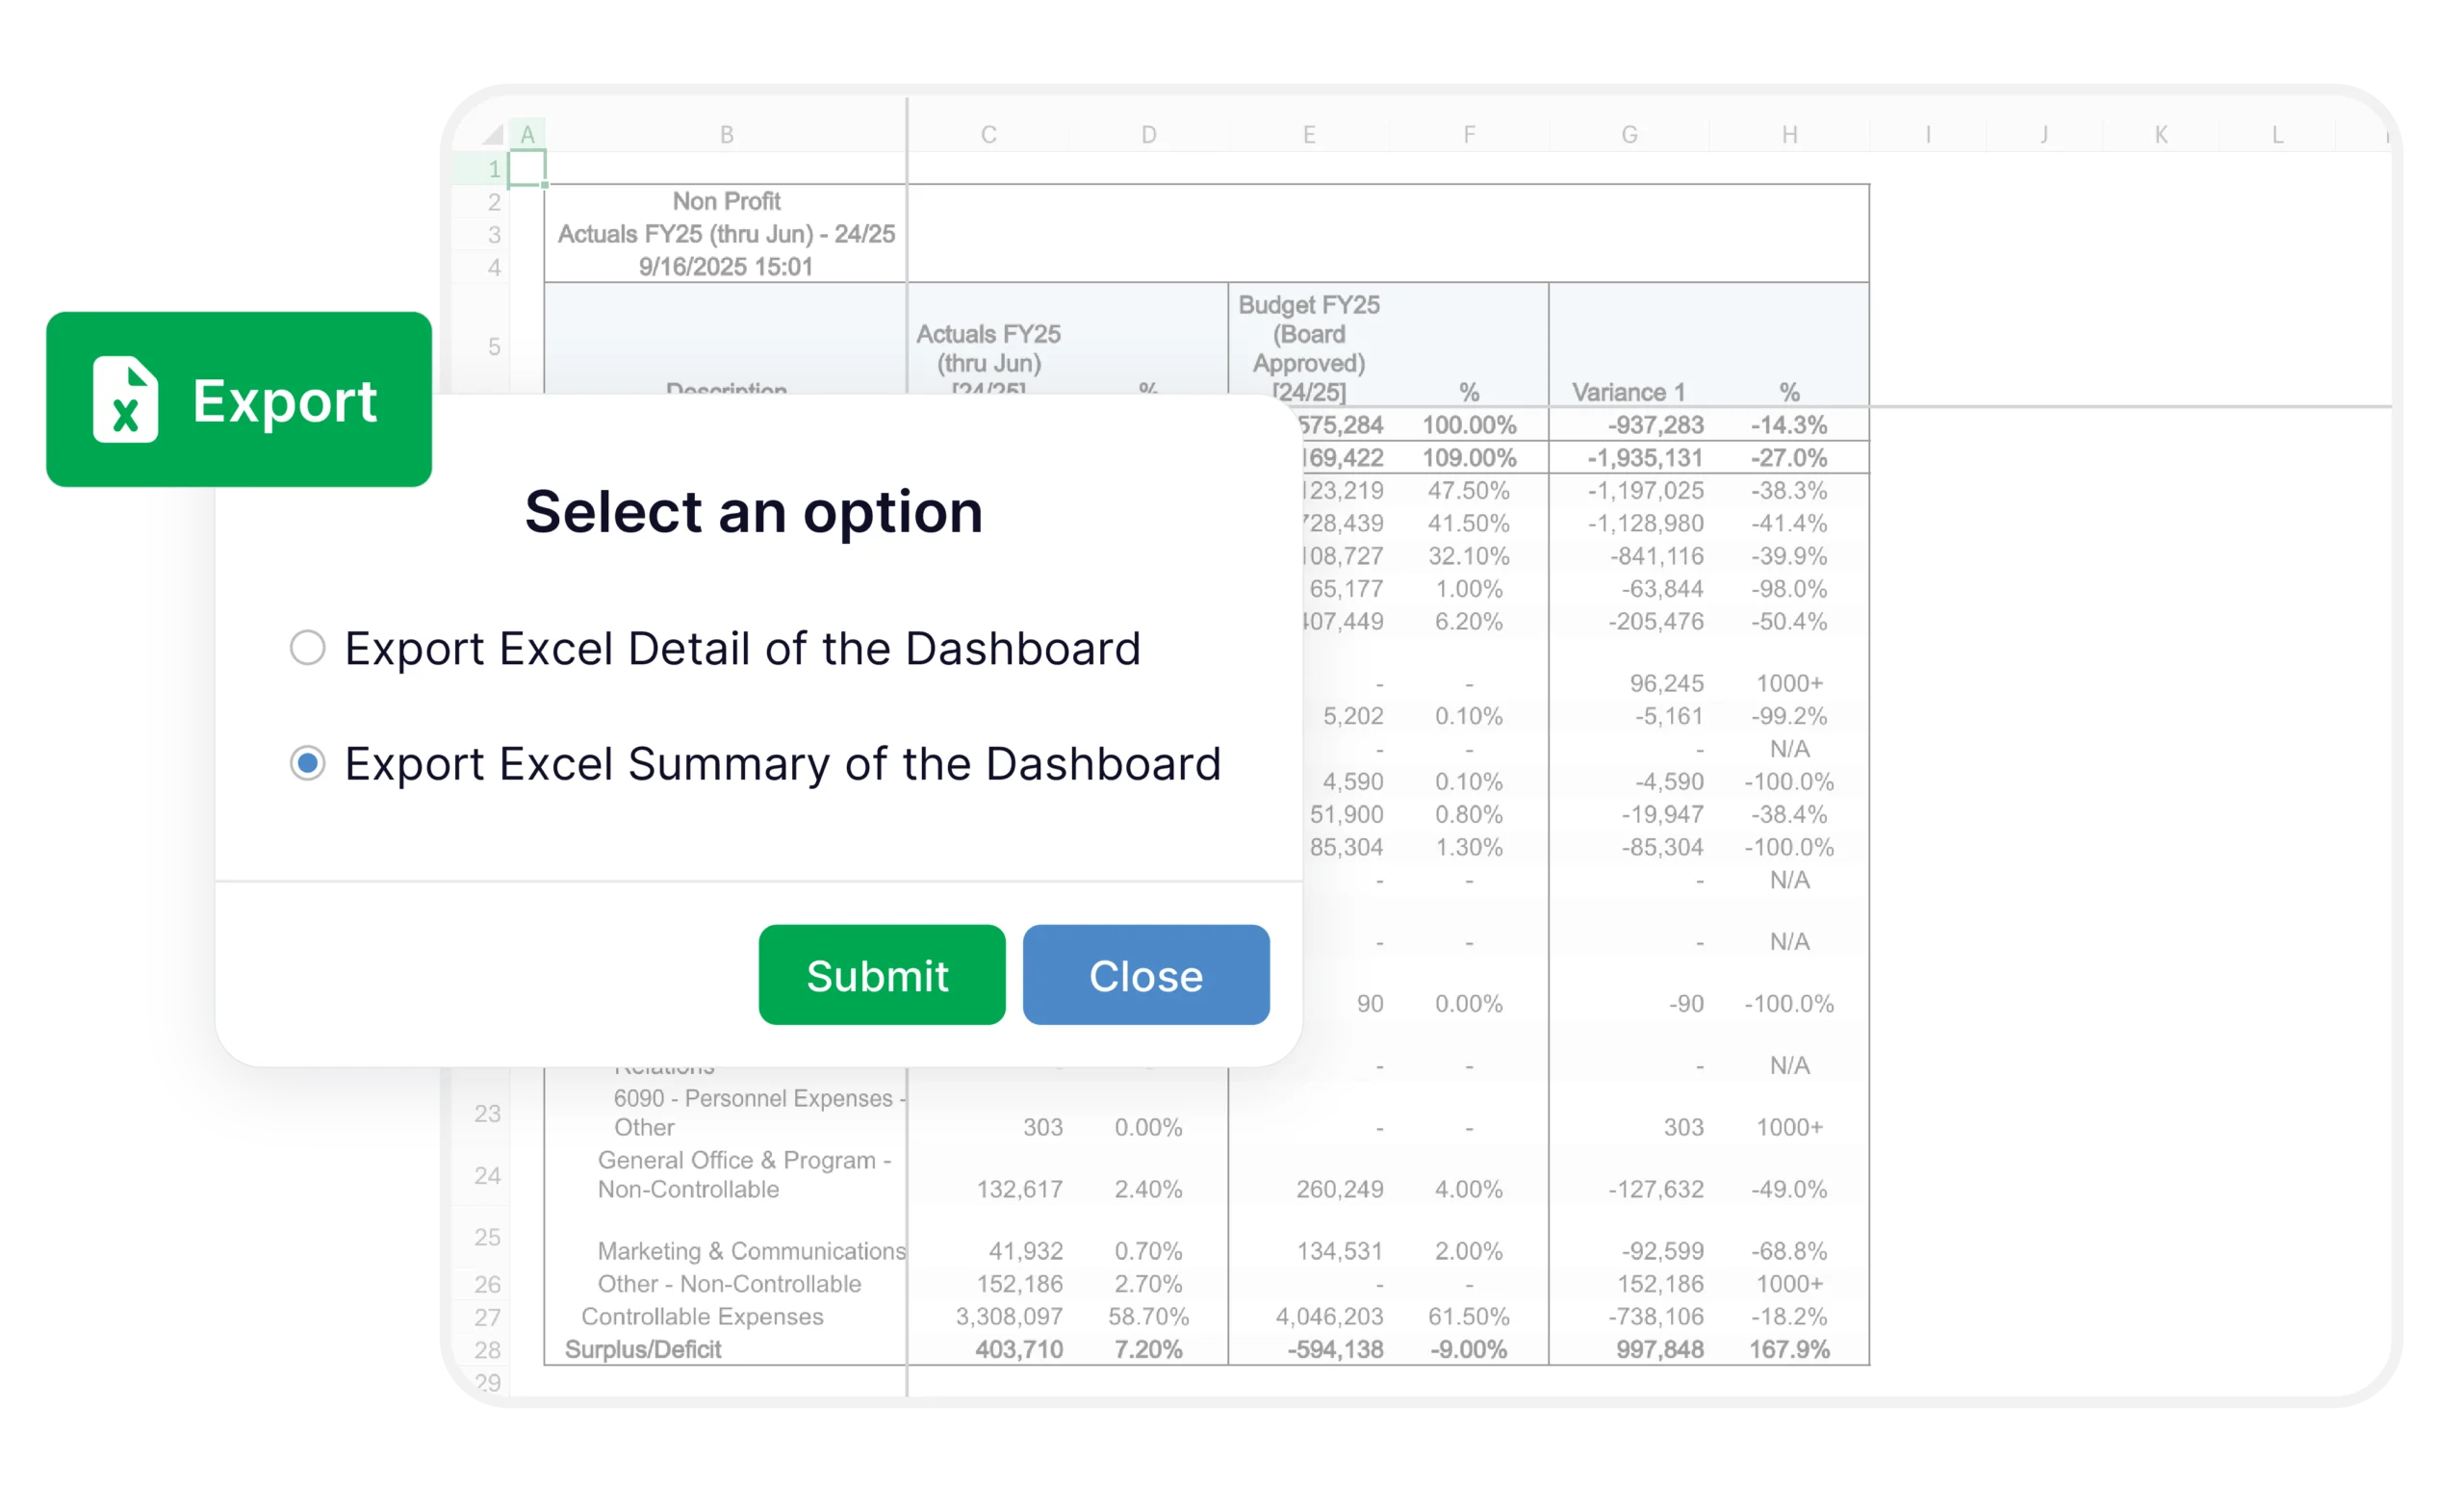
All dashboards export to fully formatted Excel reports for board presentations… if they still insist on .xlsx.
Visualize with pivot tables or charts using any fields from Budgyt. Custom ad-hoc reporting or standard reports – create any report you need.
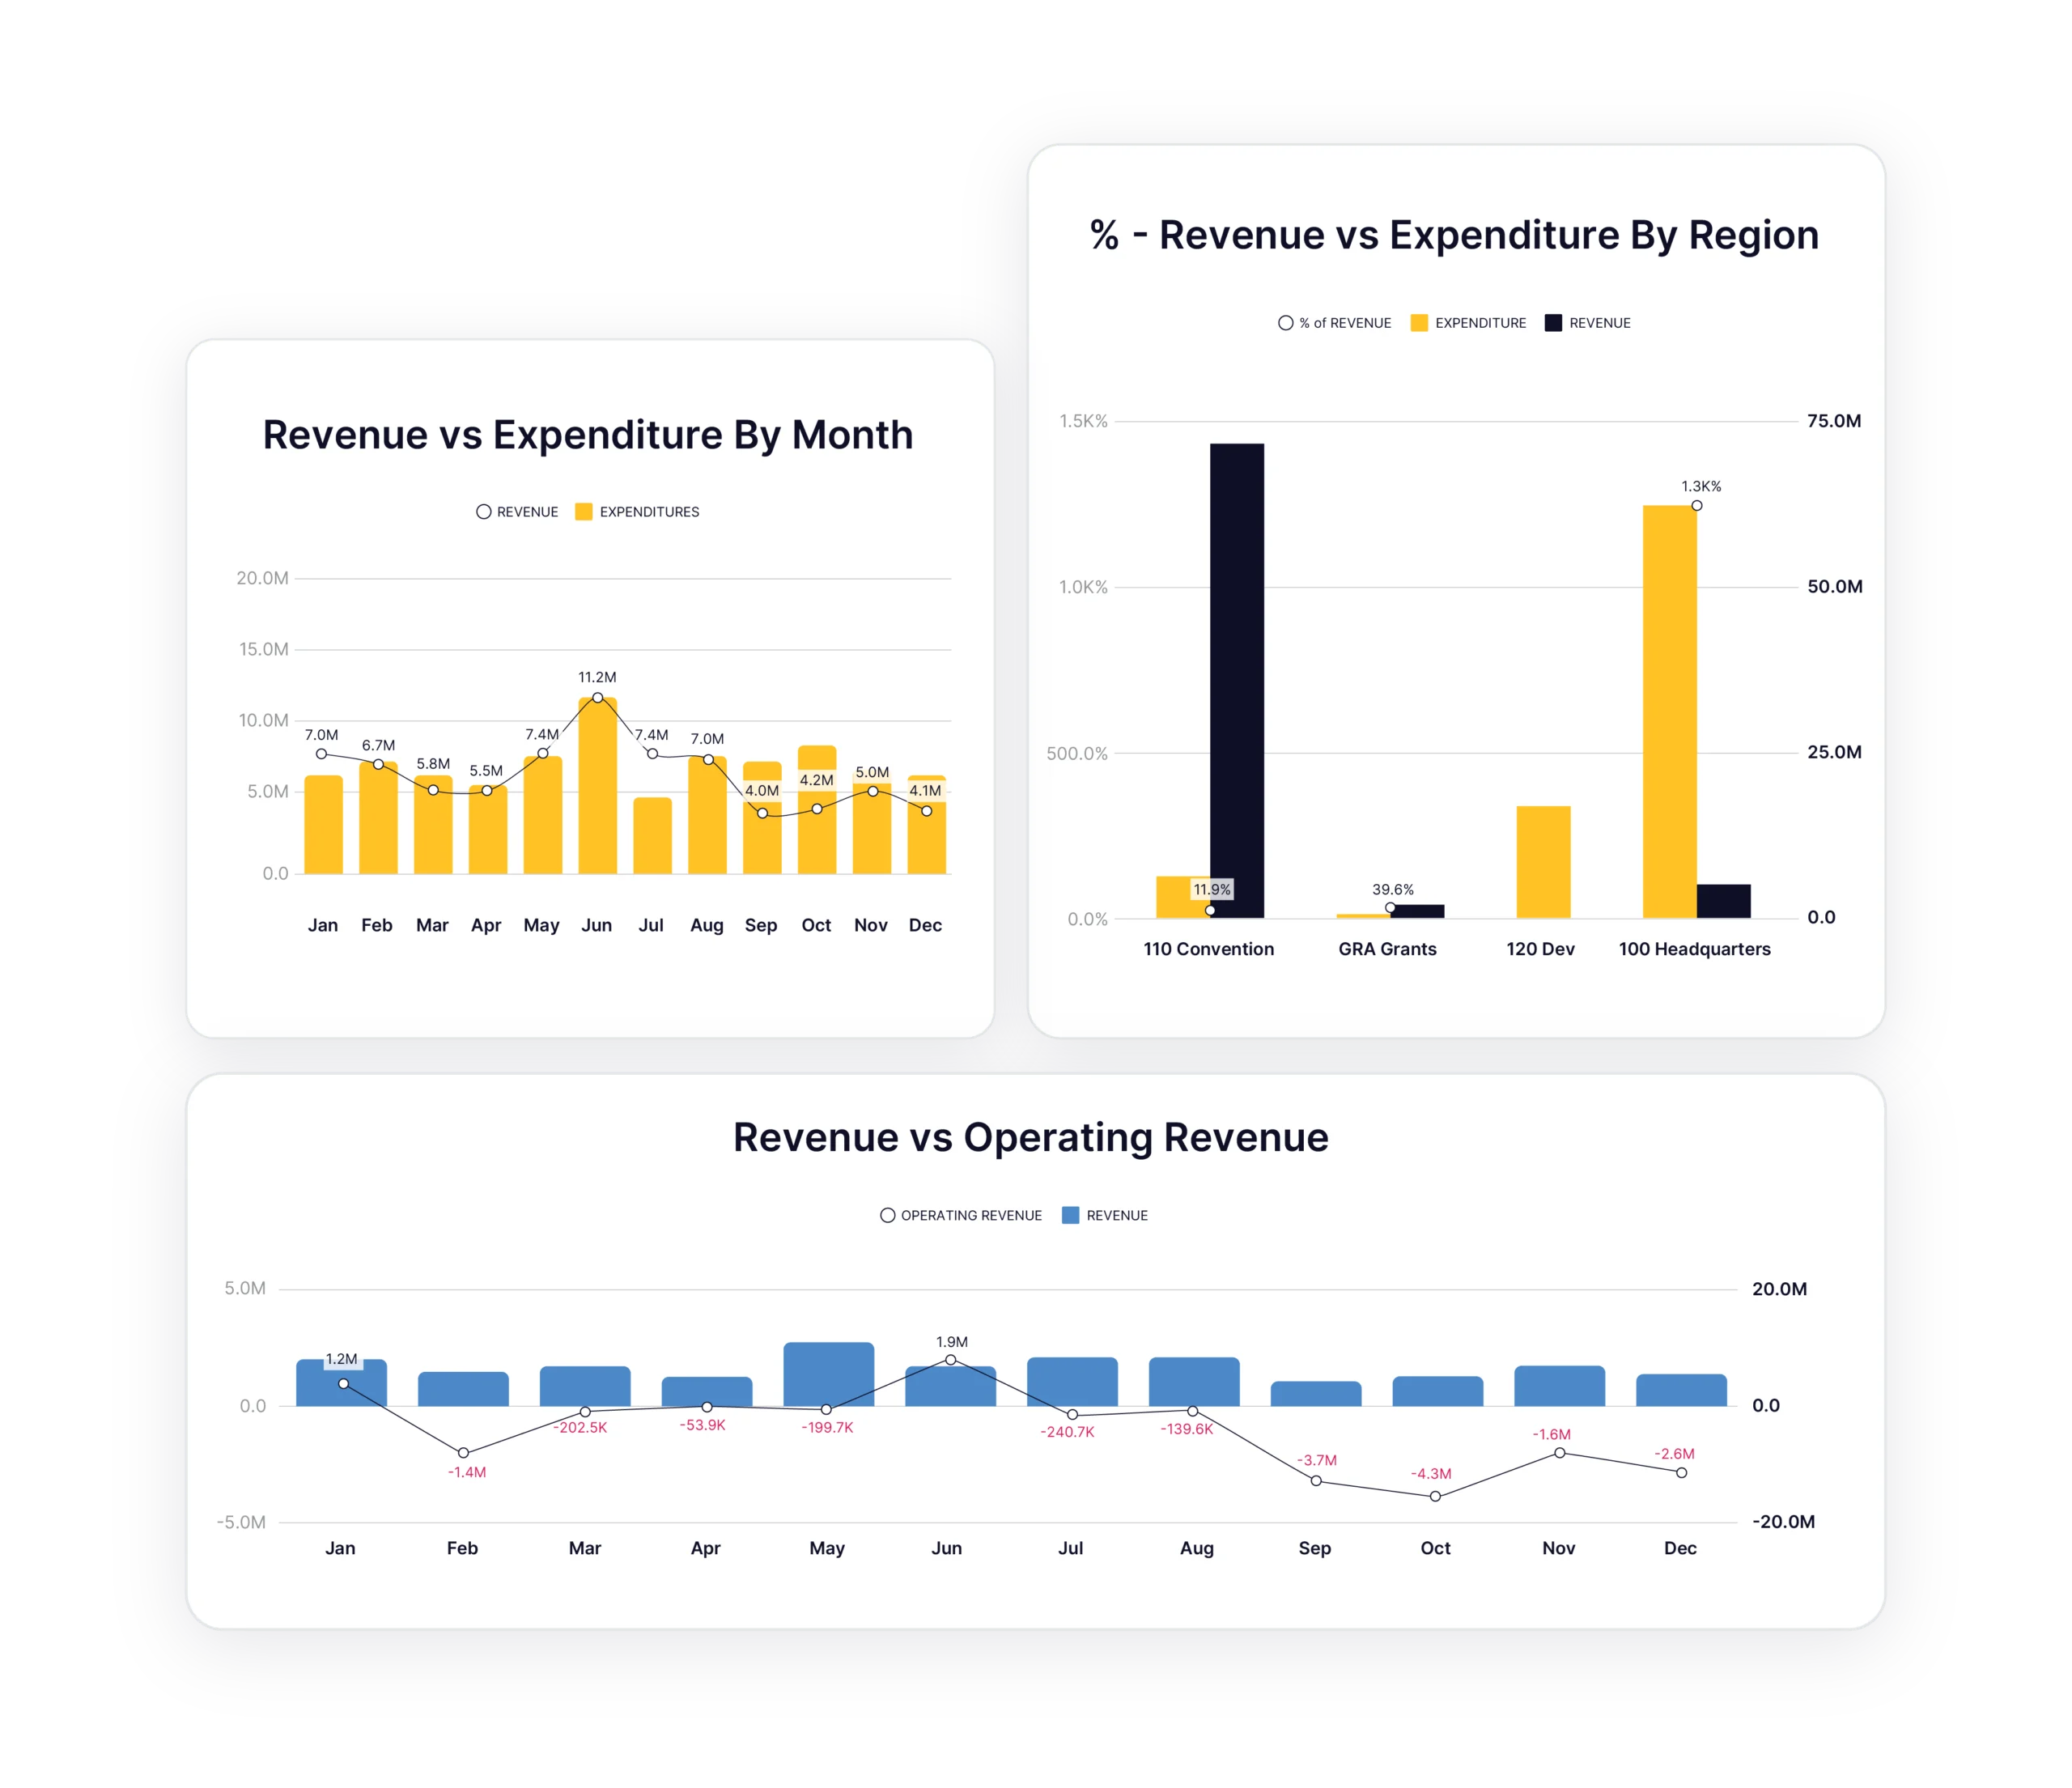
Enjoy layered visualization tools for comprehensive reporting options and generate professional reports that consistently impress.
See how Budgyt’s building tools eliminate Excel stress forever.